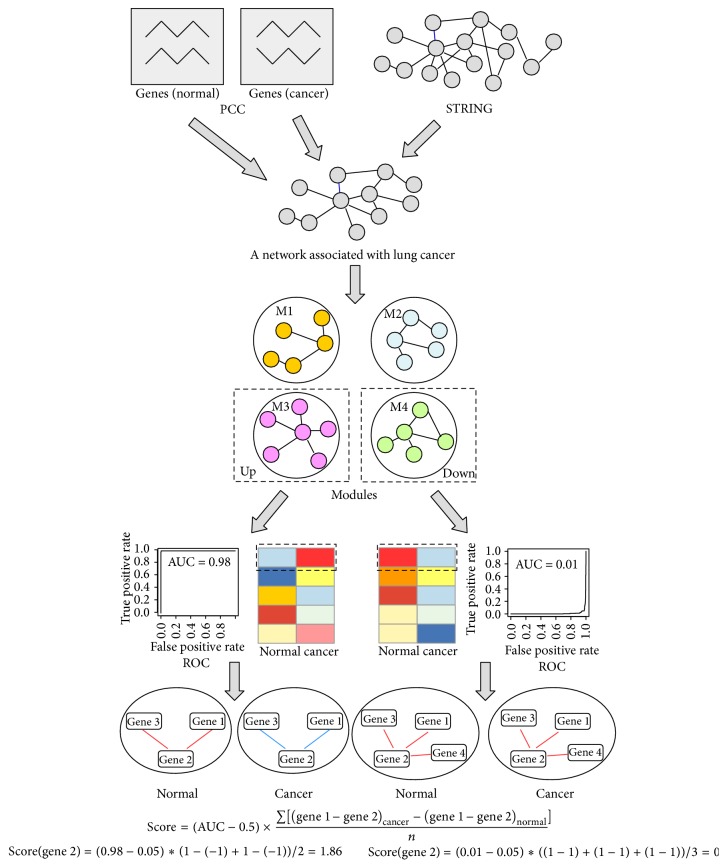
Figure 1.
The pipeline for predicting diagnostic gene biomarkers of NSCLC. In the bottom of the figure, the color of the line connecting gene 2 and the other genes indicates the coexpression status between gene 2 and the other genes, with red color corresponding to positive coexpression and blue color corresponding to negative coexpression. For details about the pipeline, refer to the Materials and Methods.

