
Figure 2.
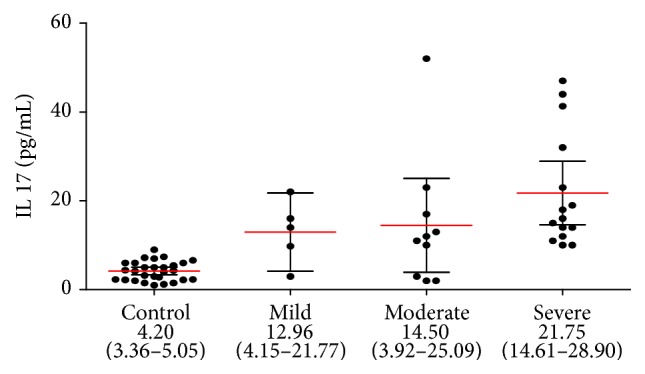
IL-17 concentration in serum of eRA disease patients with different clinical activity stages (black circles represent IL-17 concentration, pg/mL in individual serum samples; red lines represent mean values accompanied by 95% confidence interval, represented as black horizontal bars).