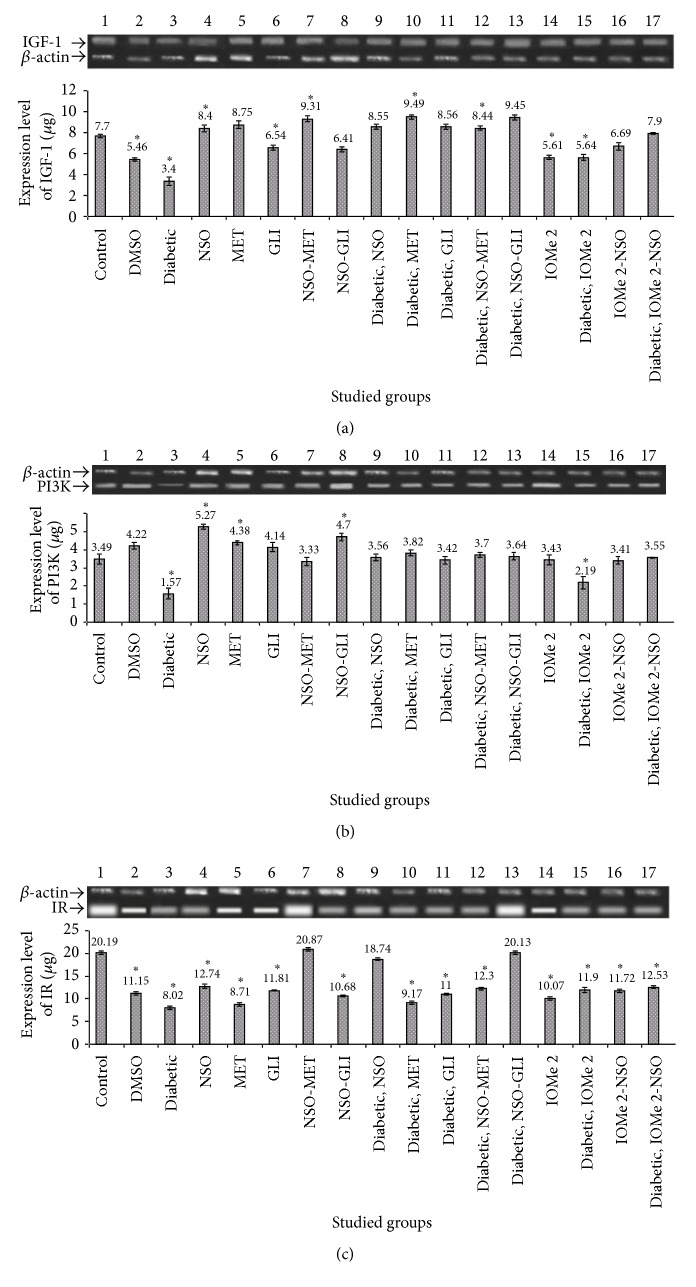
Figure 4.
Effect of NSO, reference drugs, and I-OMe-AG538 on the gene expression ratio of IGF-1/β-actin (a), PI3K/β-actin (b), and IR/β-actin (c) in rats of all studied groups. The insets show agarose gel electrophoresis of gene expression of IGF-1 (572 bp), PI3K (101 bp), and IR (129 bp) compared to β-actin (300 bp) (data are expressed as mean ± SE, n = 3). ∗Significant at p < 0.05.

