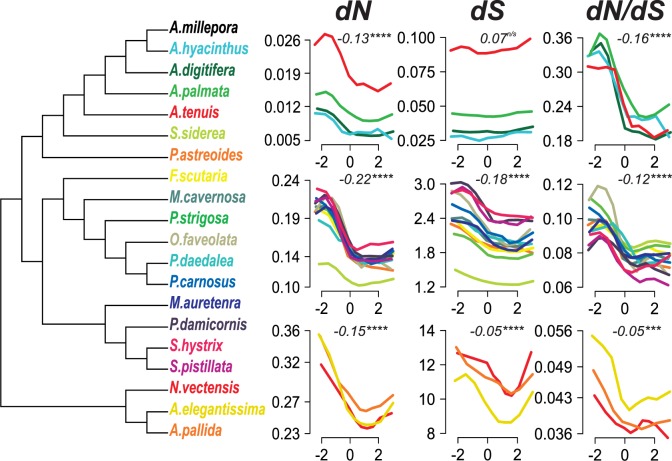
Fig. 3.
Relationship between MBD-score and substitution rates across the anthozoan phylogeny. All nodes in the phylogeny have 100% bootstrap support based on 1,000 replicates. Line plots trace the mean substitution rates for all genes divided into 10 quantiles ranked by MBD-score. Line color indicates which species A. millepora was compared with to estimate pair-wise substation rates. The top row of line plots shows comparisons within Acropora. The middle row shows corals outside of Acropora. The third row shows comparisons with anemone species. For each panel, the correlation (Spearman’s rho) and statistical significance indicate the median values across all included species. Individual correlations are reported in the Supplementary Material online. Asterisks indicate significance based on Spearman’s rank-order correlation test (ns >0.05; * <0.05; ** <0.01; *** <0.001; **** <0.0001).

