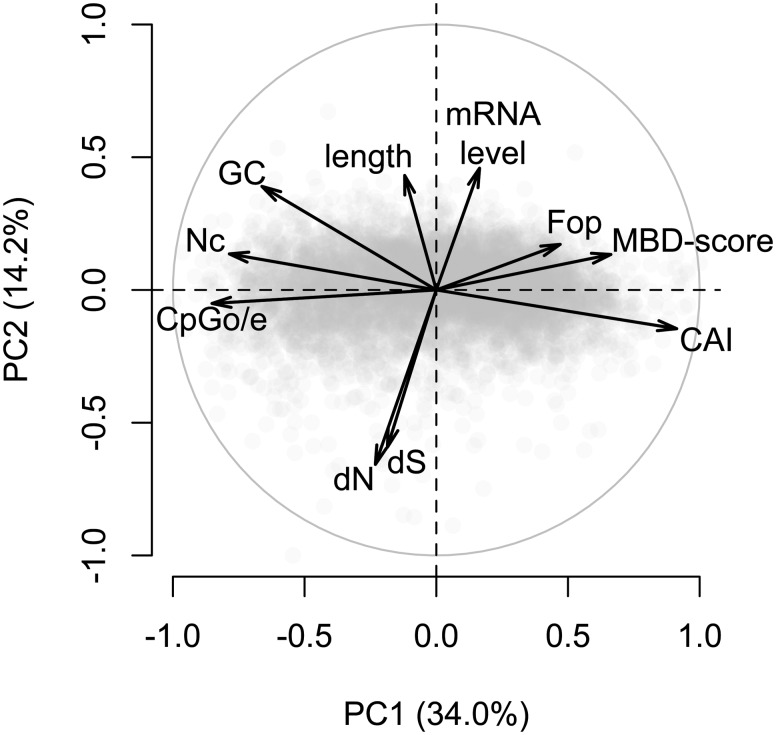
Fig. 6.
PCA of gene features in A. millepora. The first principal component explained 34.0% of variation and correlated primarily with measures of gbM and codon bias. The second principal component explained 14.2% of variation and correlated primarily with gene length, transcript abundance, and substitution rates. Variables included in the analyses are: normalized CpG content (CpGo/e), Nc, GC content of coding regions (GC), nonsynonymous substitution rate (dN), synonymous substitution rate (dS), length of coding region (length), transcript abundance (mRNA level), Fop, log2-fold difference between captured and flow-through fractions of methylation binding domain enrichment libraries (MBD-score), and CAI. Substitution rates are pair-wise estimates between A. millepora and S. siderea.

