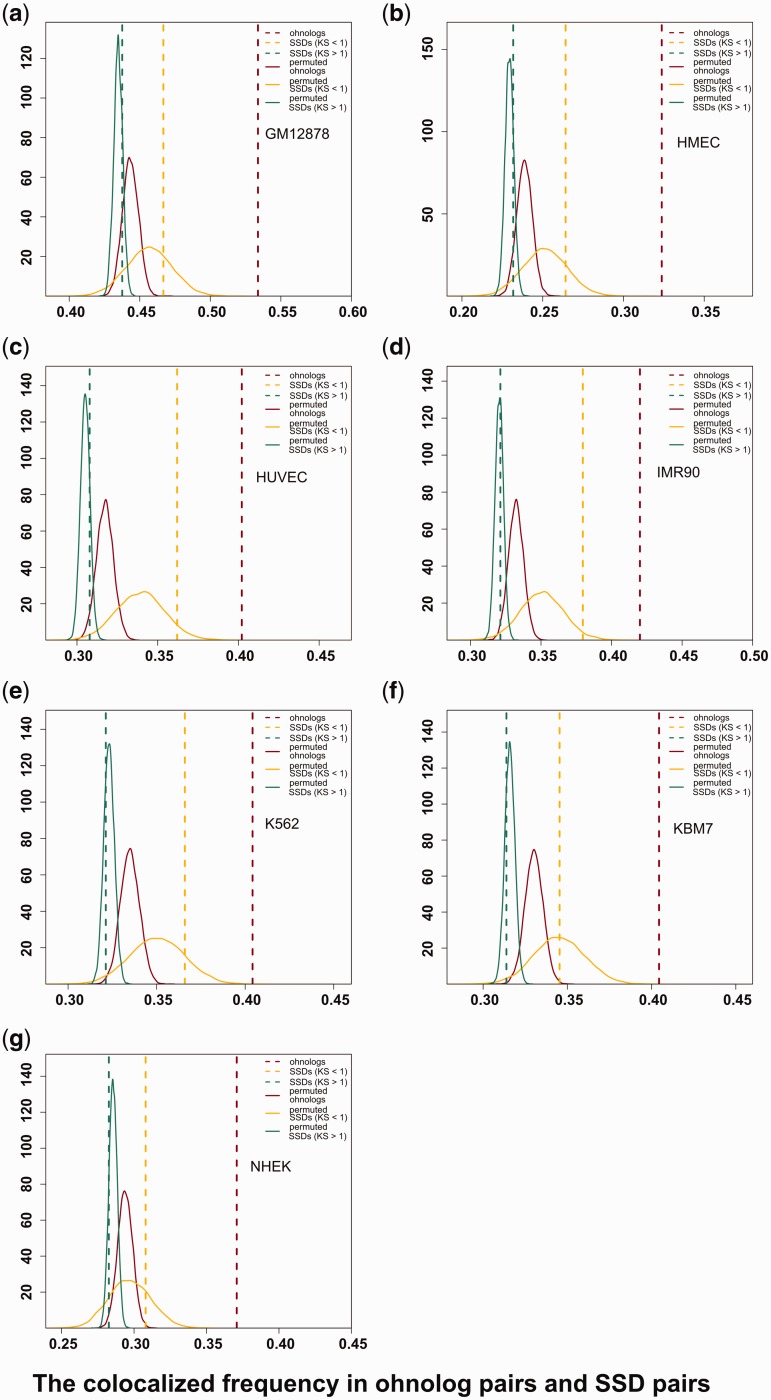
Fig. 1.
The colocalization frequency of interchromosomal ohnolog pairs and SSD pairs in seven cell lines. In each panel, the x-axis represents the percentage of colocalized interchromosomal ohnolog pairs and SSD pairs in the different cell lines. The brown, yellow, and green vertical dashed lines indicate the observed colocalization frequency for ohnologs pairs, young SSD pairs, and old SSD pairs, respectively. The curves show the colocalization frequency distributions for 10,000 permuted randomizations of the same number of pairs as in the real data.

