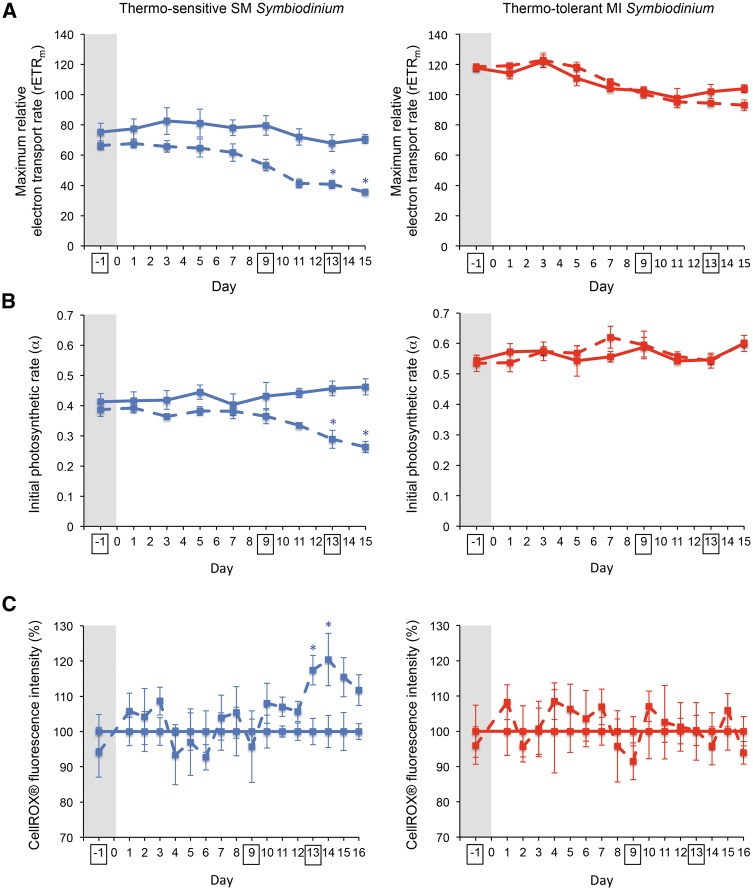
Fig. 1.
Physiological detection of Symbiodinium heat stress. Intact lines represent the 27 °C temperature treatment, and dashed lines represent the 32 °C temperature treatment. Before heating, all samples were kept at 27 °C (values in the grey regions). (A) rETRm (mean ± sem, n = 4). (B) α (mean ± sem, n = 4). (C) Leakage of ROS out of cells (mean ± sem, n = 4); unitless fluorescence intensities of CellROX® Orange reagent for oxidative stress detection were normalized across days by setting the fluorescence intensities of the 27 °C samples to 100%. Asterisks indicate statistically significant (PERMANOVA) differences between temperature treatments at P < 0.05. Sampling time points for transcriptomics are boxed. Additional physiological measurements are shown in supplementary fig. S1, Supplementary Material online.

