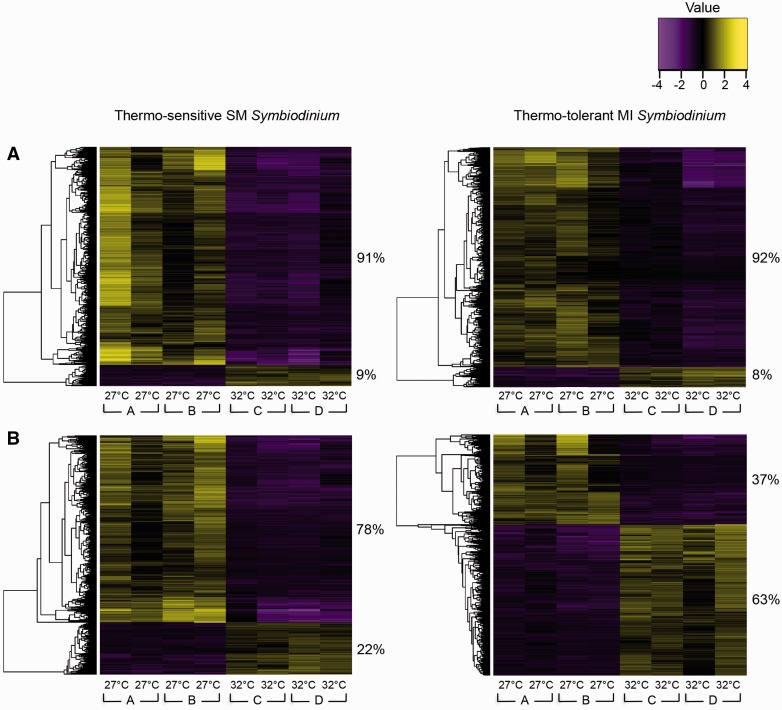
Fig. 2.
Hierarchical clustering of DEGs. Heat maps show genes (rows) with differential expression (Trinity/edgeR: fold ≥ 4, FDR ≤ 0.001) between 27 °C and 32 °C samples (columns) for each population on (A) day 9 and (B) day 13. Expression values (fpkm) are log2-transformed and then median-centered by gene. Heat map values were calculated by subtracting each gene’s median log2(fpkm) value from its log2(fpkm) value in each sample. The proportions (%) of DEGs that were up- or down-regulated due to heat stress are noted to the right of the two main gene clusters of each heat map. Genes are independently clustered for each population at each time point. Samples from replicate cultures at each temperature treatment are presented in the same order for each time point. The experimental incubator (A, B, C, or D) that housed each sample is noted below the temperature treatment.

