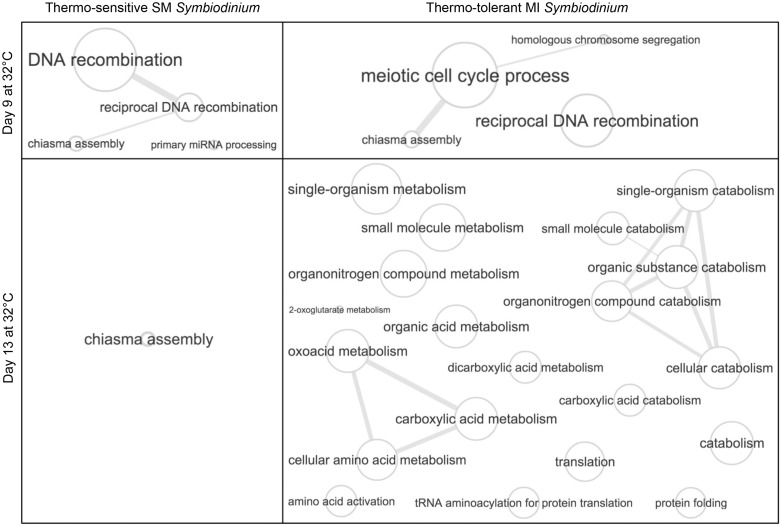
Fig. 3.
Unsuccessful versus successful acclimation to elevated temperature. GO relationship graphs for enriched biological process GO categories (Goseq: FDR < 0.05) at 32 °C were generated using REVIGO (Supek et al. 2011). Bubble size indicates the frequency of the GO category in the UniProt database relative to the other GO categories that are in the same section. Lines link similar GO categories, and the line width indicates the degree of similarity between the GO categories relative to others in the same section. Redundant GO categories (similarity > 0.9) were collapsed into the category that is most frequent in the UniProt database. Graphs for enriched molecular function GO categories (e.g., unfolded protein binding and glutamate dehydrogenase activity) and enriched cellular component GO categories (e.g., oxidoreductase complex and motile cilium) at 32 °C are not included in this figure. Full GO analysis results are listed in supplementary dataset S1A–M, Supplementary Material online.

