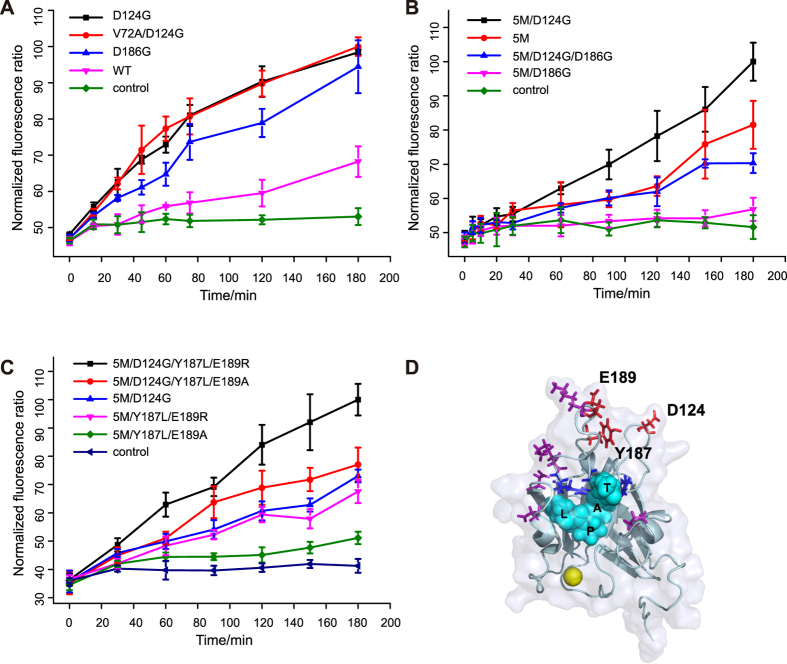
Figure 2. Screening results of the SrtA enzyme.
(A) Validation of the screening results of the random mutagenesis library. Time lapse measurement of fluorescence ratio was conducted with 1 μM SrtA. 100 μM EGFP and 200 μM cpVenus. Error bars are ± s.d. from the mean of three parallel experiments. (B) Combination of beneficial mutations (D124G and D186G) with previously reported 5M mutant. D124G improve the efficiency of the enzyme (black line) while D186G dramatically reduced the efficiency (blue and magenta line). Data represent mean values ±s.d. from three parallel experiments. (C) Validation of the screening results of the site-directed saturation mutagenesis library and the rational designed combinations. Mutants harboring mutations at residues Y187 and E189 (magenta and green line) showed improved efficiency. Combination with D124G further improved the efficiency of the mutants (black and red line). Error bars are ±s.d. from three parallel experiments. (D) Crystal structure of SrtA in complex with substrate peptide (PDB entry: 2KID). Cyan sphere: Peptide substrate; Blue: Residues involved in substrate-enzyme intermediate formation H120, C184, R197; Magenta: pentamutant; Red: residues evolved in this paper.

