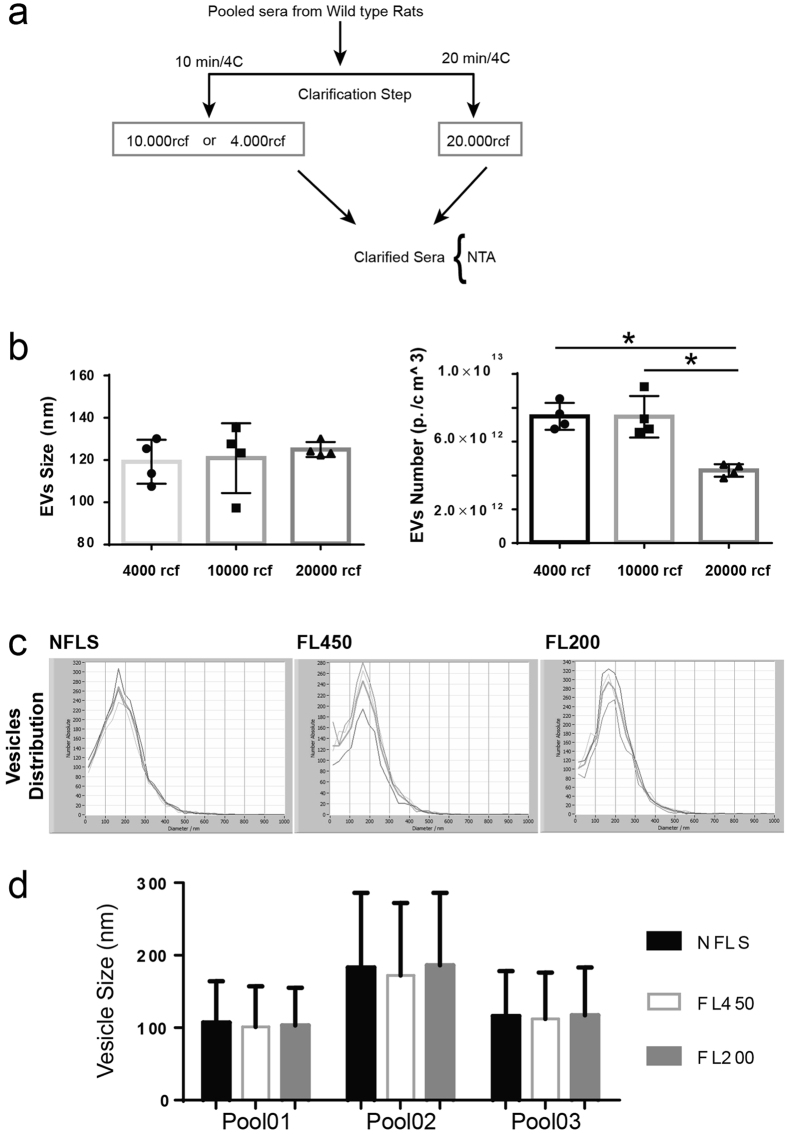
Figure 3. Filtration does not affect distribution of vesicles isolated by TEI-induced precipitation.
Pool of rat sera were either filtered through 0.2 μm (FL200) or 0.45 μm (FL450) syringe filters or left unfiltered (NFLS) before isolation by addition of appropriate quantity of TEI. Following, vesicle distribution was measure by using NTA. (a) Schematic representation of experimental procedure is shown. (b) Vesicles size distribution and (c) vesicles peak as measured by NTA for three independent pools. Data are represented as average ± standard deviation. *P ≤ 0.05.

