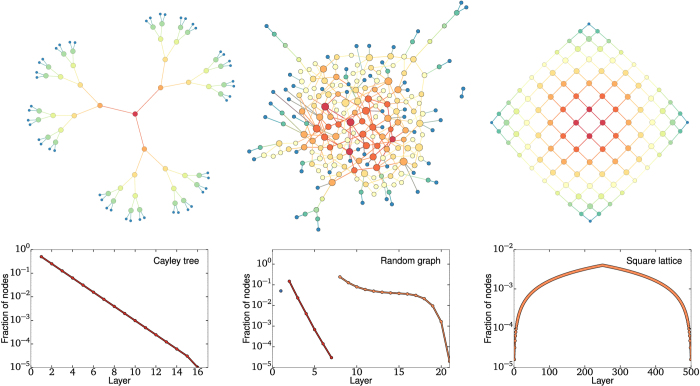
Figure 2. A few model networks and their onion spectra.
(left) The perfect tree with branching factor of two. (middle) A fully random Erdős-Rényi graph. (right) A square lattice. In all cases, node size is proportional to its degree within the shown subset while node color indicates where the nodes are found in the onion decomposition, from blue for shallow nodes to red for deep nodes. In the onion spectra, dot colors and lines are used to indicate layers corresponding to the same k-shell. Note that colors are used for contrast and do not correspond to node color in the network cartoons. Both the Cayley tree and the square lattice only have one shell, corresponding to a 1-core and a 2-core, respectively, while the random graph features 3 cores, roughly corresponding to disconnected nodes, a tree-like periphery and a dense core. The distribution of nodes per layer in the Onion Decomposition tell us something about the structure as, for example, a tree is explored exponentially and a lattice linearly.

