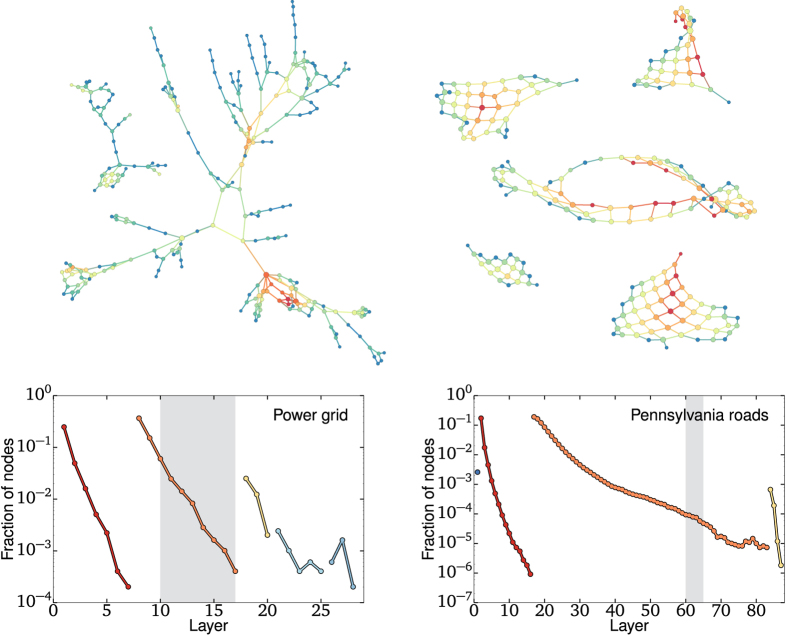
Figure 3. Onion spectra of the Northwestern American power grid and of the Pennsylvania road system and representative subgraphs.
As in the model networks of Fig. 2, the tree-like structure of the power grid and the lattice structure of the road networks are reflected in the exponential and sub-exponential decay of layer density per shell in the onion spectra, respectively. Again, dot colors in the spectra reflect layers belonging to different shells whereas node color in the networks correspond to the shells in which they are found (shaded layers in the spectra, only links between nodes belonging to the subgraph are shown).

