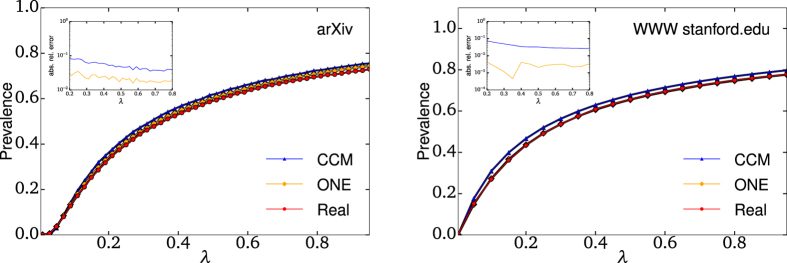
Figure 6. Simulations of the SIS epidemic process.
The prevalence (number of infectious nodes) associated with the steady state of the SIS dynamics as a function of the dimensionless parameter λ on (left) the co-authorship network from the arXiv and (right) links between stanford.edu pages. Simulations on the real original networks are shown in red, and those on networks rewired according to the Correlated Configuration Model (CCM) and the ONE are shown in blue and orange, respectively. The insets show the absolute value of the relative errors on predictions from the rewired networks. Note that prevalence observed on the stanford.edu network and on its ONE are almost indistinguishable. In addition to its more accurate results, the ONE requires significantly less information than the CCM.

