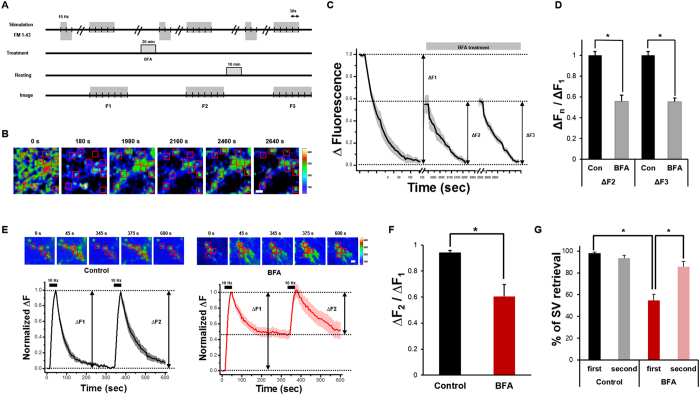
Figure 1. SVs are solely retrieved by BFA-insensitive endocytic pathway in the presence of BFA.
(A) Hippocampal neurons at DIV19 were loaded with FM 1–43 by field stimulation (300 APs at 10 Hz) and kept for an additional 30 s after the stimulation to label all endocytosed vesicles. After 10 min of resting period, a stimulus of 1,200 APs at 10 Hz was given to unload FM 1–43. After the first round of dye loading/unloading, neurons were treated with 10 μg/ml BFA for 30 min (n = 220 neurons from 9 independent coverslips). (B) Representative fluorescent time-lapse images of presynaptic boutons treated with FM 1–43. Individual regions were selected by hand and rectangular regions of interest (red) were drawn around the synaptic boutons, then average intensities were calculated. Large puncta, which are clusters of synapses, were excluded from the selection procedure. Right: heat-map for pseudo-colored fluorescence intensity. Scale bar: 1 μm. (C) The extent of SV turnover during the first (ΔF1), second (ΔF2) and third cycle (ΔF3). All values were normalized to ΔF1. Error bars: SEM. (D) ΔF2 and ΔF3 over ΔF1, respectively. Data are presented as means ± SEM *p < 0.01 (Student’s t-test). (E) Representative fluorescent time-lapse images of SypHy transfected presynaptic boutons. Average SypHy fluorescence intensity profiles of the control (black) and BFA treated neurons (red) that were stimulated with 300 APs at 10 Hz twice. ΔF1 = (Fmax of the first stimulation − F0 before the first stimulation), ΔF2 = (Fmax of the second stimulation − F0 before the second stimulation). All values were normalized to ΔF1. Error bars: SEM (n = 83 neurons from 9 independent coverslips for control group, n = 69 neurons from 6 independent coverslips for BFA treatment group). Scale bar: 1 μm. (F) The ratio of ΔF2 over ΔF1. *p < 0.01 (Student’s t-test). (G) % of SV retrieval was calculated by (Fmax of each stimulation − F300 s after each stimulation)/(Fmax of each stimulation − F0 before each stimulation) × 100. Data are presented as means ± SEM *p < 0.01 (Student’s t-test).

