Figure 4.
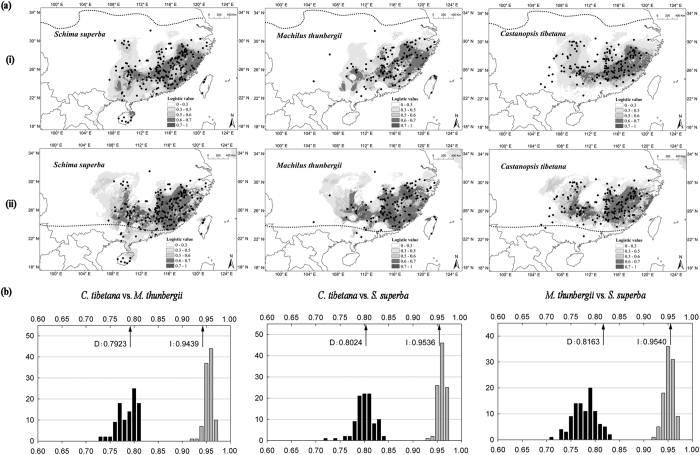
(a) Predicted distributions of Castanopsis tibetana, Machilus thunbergii and Schima superba based on species distribution modeling (i) at present (1950–2000), (ii) at the Last Glacial Maximum (LGM; c. 21 kya). Species distribution models were established with bioclimatic variables on the basis of extant occurrence points (black dots) of the three species using maxent version 3.3.3 k (http://www.cs.princeton.edu/~schapire/maxent/). The dashed lines indicate the northern borders of EBLF today and during the LGM inferred from PBR (modified after Harrison et al., 2001). Maps were generated using ArcGIS version 9.3 (http://www.esri.com/software/arcgis/arcgis-for-desktop). (b) The results of identity tests using enmtools version 1.3. The black Bar indicates the null distributions of D, and gray bar indicates the null distributions of I. Both are generated from 100 randomizations. X-axis indicates value of I and D, Y-axis indicates number of randomizations. The arrow indicates the value in actual maxent runs. The Histograms were drawn using SigmaPlot 10.0.

