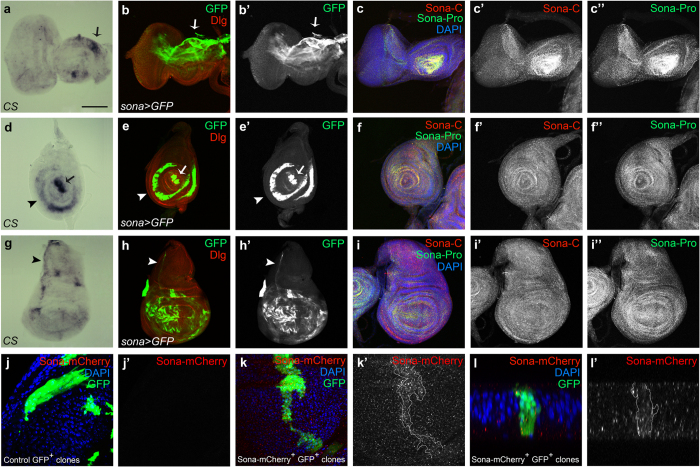
Figure 4. Expressions of sona transcripts and Sona proteins in flies and S2 cells.
Eye-antenna discs (a–c), leg discs (d–f) and wing discs (g–i) from late third instar larvae were shown. (a,d,g) in situ hybridization with sona cDNA as a probe. Arrows and arrowheads indicate the region with high level of sona transcripts. (b,e,h) The pattern of GFP expressed by sona-Gal4. Discs-large (Dlg) was used as membrane marker. (c,f,i) The localization pattern of Sona visualized with two Sona antibodies, Pro- and C-antibodies. (j–l) Patterns of Sona-mCherry produced from a Sona-mCherry+ clone in a wing disc (k) or that of control (j). The Sona-mCherry+ clone is outlined in (k’). A cross section view of the same clone in (k) at the DV boundary (l). Black and white images of GFP, Sona-C, Sona-Pro or Sona-mCherry are shown. Scale bars: (a–i) 100 μm; (j,k) 30 μm; (l) 9.5 μm.

