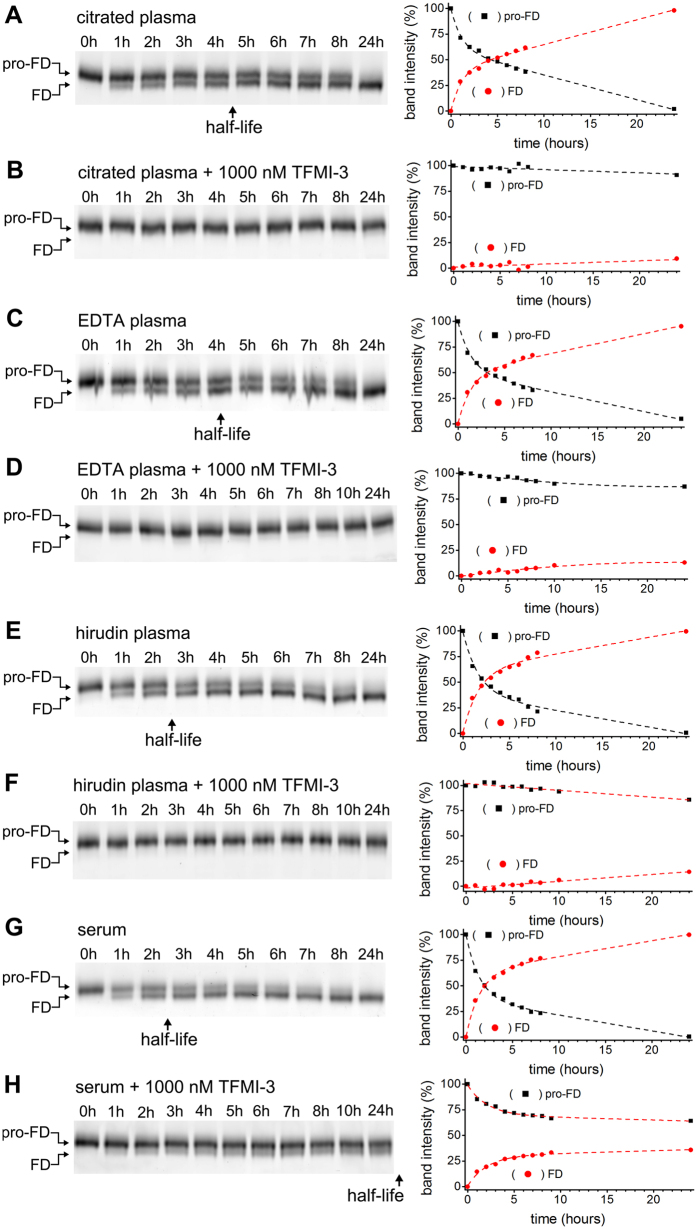
Figure 4. Inhibition of pro-FD activation by TFMI-3.
Conversion of Cy3-labeled pro-FD to Cy3-FD (referred to as activation) in different types of normal human blood preparations was detected by reducing SDS-PAGE followed by fluorimetric scanning and densitometry. Representative gels out of at least 2 parallels are shown on the left side. On the right side of each panel densitometric analysis of the pro-FD and the FD bands of the same gel is shown. The intersection point of the dashed trend lines gives the half-life of pro-FD. Calculated half-lives are found in s 3. (A) Activation of Cy3-pro-FD in citrated normal human plasma. (B) Lack of significant activation of Cy3-pro-FD in citrated normal human plasma in the presence of 1000 nM TFMI-3. (C) Activation of Cy3-pro-FD in normal human EDTA plasma. (D) Lack of significant activation of Cy3-pro-FD in normal human EDTA plasma in the presence of 1000 nM TFMI-3. (E) Activation of Cy3-pro-FD in hirudin-treated normal human plasma. (F) Lack of significant activation of Cy3-pro-FD in normal human hirudin plasma in the presence of 1000 nM TFMI-3. (G) Activation of Cy3-pro-FD in normal human serum. (H) Delayed activation of Cy3-labelled pro-FD in normal human serum in the presence of 1000 nM TFMI-3.

