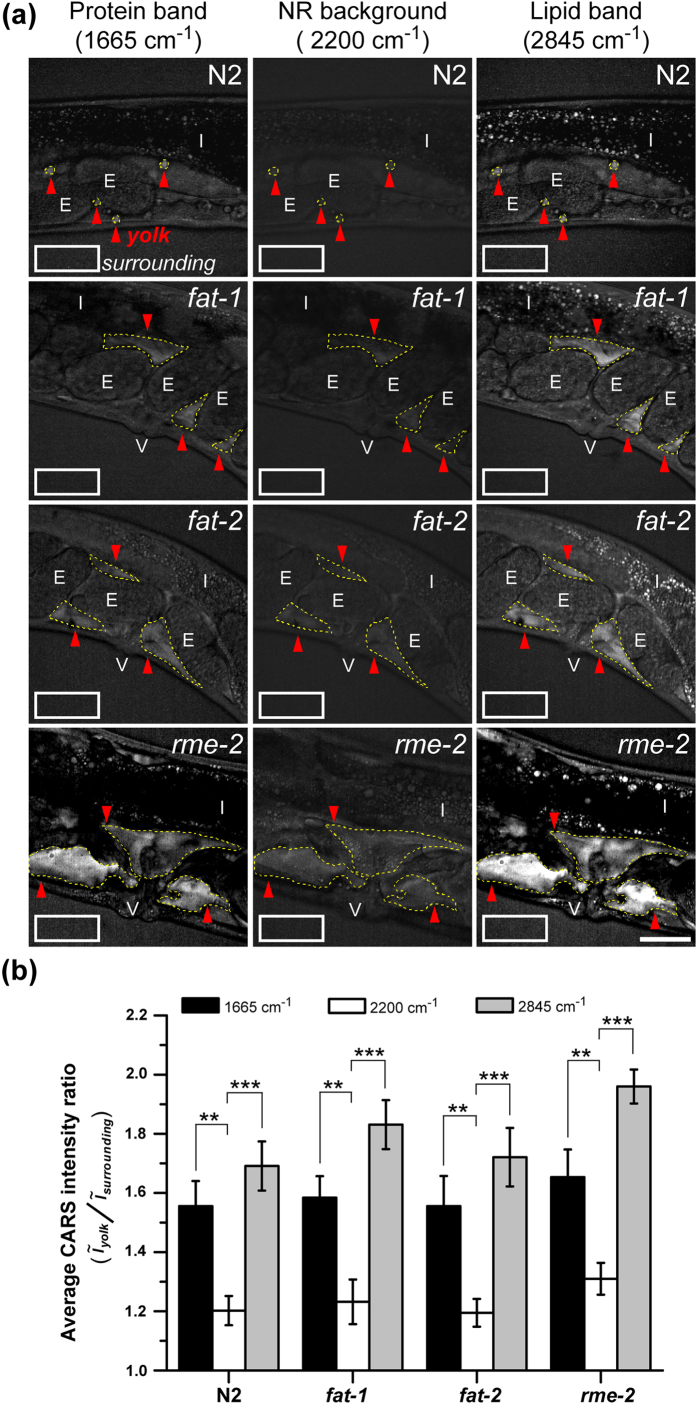
Figure 1. The accumulation of secreted yolk lipoprotein in the pseudocoelom of N2, fat-1, fat-2, and rme-2 mutants.
(a) CARS Images of N2, fat-1, fat-2, and rme-2 mutants containing yolk lipoprotein accumulation measured at three different vibrational frequencies. Red arrows and white rectangles represent the regions of yolk lipoprotein accumulation and surrounding buffer, respectively. E stands for embryo, I stands for intestine, and V stands for vulva. Scale bar = 30 μm. (b) The average CARS intensity ratio between yolk lipoprotein accumulation (red arrows in (a)) and surrounding buffer (white rectangles in (a)) at three vibrational frequencies. Black bar for ~1665 cm−1 (protein band), white bar for ~2200 cm−1 (non-resonant background), and gray bar for ~2845 cm−1 (lipid band) (n = 10~15). All worms are 1D-Ad worms. Error bars represent the standard error of the mean (SEM). (P-value: *p < 0.05, **p < 0.01, ***p < 0.001).

