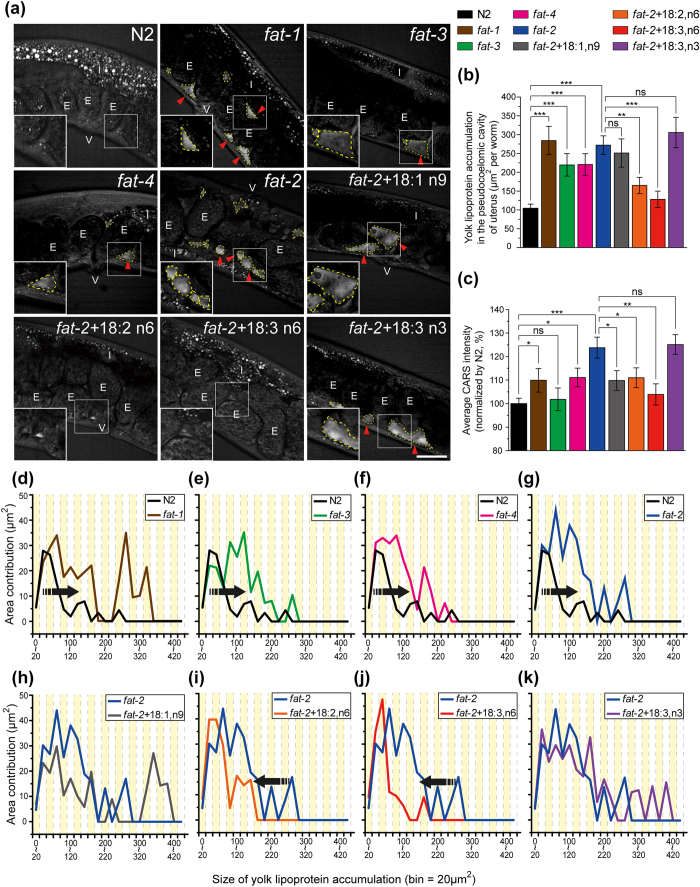
Figure 3. Analysis of yolk lipoprotein accumulation in PUFA-deficient mutants.
(a) The CARS images of N2, PUFA-deficient mutants (fat-1, fat-2, fat-3, and fat-4), and fat-2 worms supplemented with PUFAs. Red arrows indicate the regions of yolk lipoprotein accumulation. E stands for embryo, I stands for intestine, and V stands for vulva. Scale bar = 30 μm. (b) The total area and (c) the average CARS intensity of yolk lipoprotein accumulations in the pseudocoelomic cavity of uterus in different worms. (n = 57 for N2, and n = 19~32 for mutants and PUFA-supplemented fat-2 worms) All worms are 1D-Ad worms. Error bars represent the SEM. (d–k) The area contribution curves of yolk lipoprotein accumulations in various strains. (P-value: *p < 0.05, **p < 0.01, ***p < 0.001, ns: not significant).

