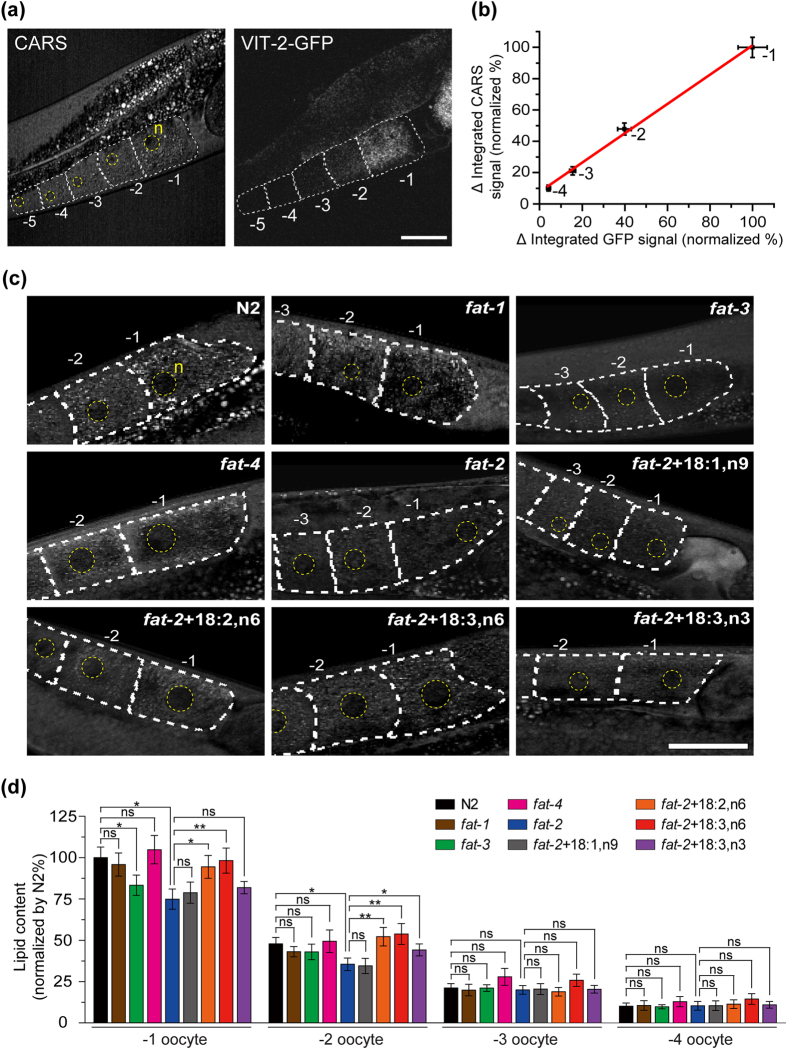
Figure 4. Quantitative analysis of lipid content in oocytes.
(a) CARS and two-photon excitation fluorescence images of the oocytes of a wild-type worm with vit-2p::vit-2::gfp transgene expression. n: nucleus. (b) The correlation between Δ integrated GFP signal and Δ integrated CARS signal of each oocyte. The red line represents the linear regression (R2 > 0.99). Each data point represents the average ± SEM (n = 17). (c) The CARS images of the oocytes and (d) The normalized amount of lipid stored in the oocytes of N2, fat-1, fat-3, fat-4, fat-2, and fat-2 worms supplemented with 18:1,n9, 18:2,n6, 18:3,n6, and 18:3,n3 (n = 9~11). All are 1D-Ad worms. Error bars represent the SEM. Scale bar = 30 μm. (P-value: *p < 0.05, **p < 0.01, ***p < 0.001. ns: not significant).

