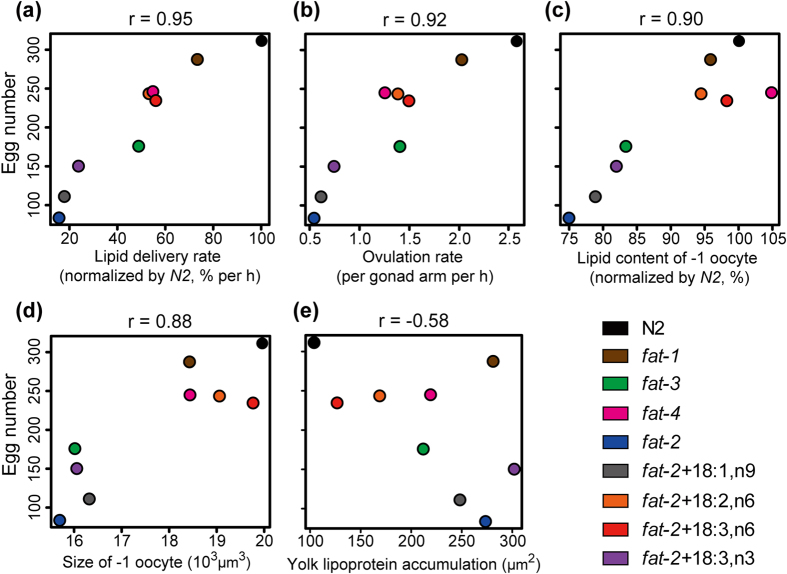
Figure 6. The correlation between various quantitative results and egg number.
The scatter plots of (a) lipid delivery rate, (b) ovulation rate, (c) lipid content, (d) oocyte size, and (e) total area of yolk lipoprotein accumulation versus egg number, together with the values of the Pearson’s product-moment correlation coefficient (r). The analyses were conducted using R40.

