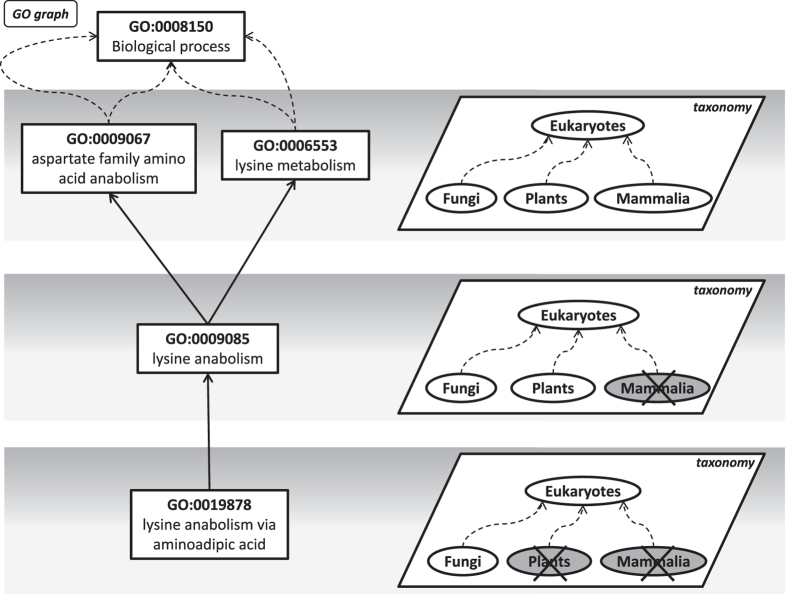
Figure 1. Distribution of functions over taxa.
On the left, the GO graph represents functions with different levels of specificity, ranging from the most specific up to the most generic definitions. On the right, the application of the constraints on taxa: the term GO:0019878 (allowed for Fungi but denied for Plants and Mammalia, that are grey shaded) is more specific than GO:0009085 (allowed for Fungi and Plants), that in turn is more specific than GO:0009067 and GO:0006553 (both GO terms are allowed for Fungi, Plants and Mammalia). The root of the graph (GO:0008150) gathers all the biological processes.

