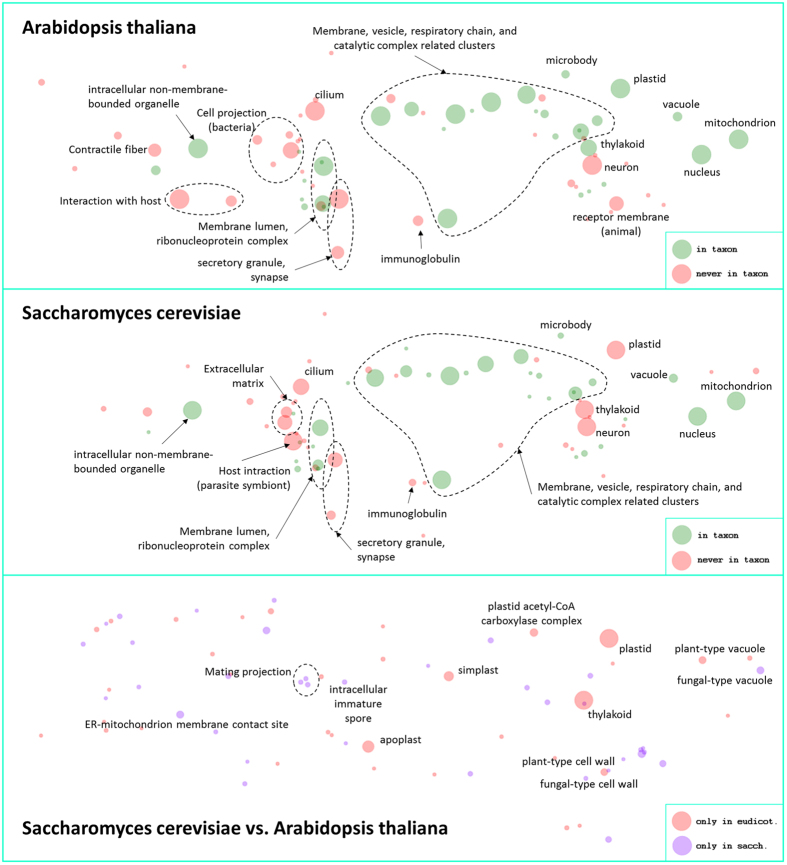
Figure 5. FunTasMaps of clustered constraints from cellular components of A. thaliana and S. cerevisiae.
In the upper and middle boxes, the A. thaliana and S. cerevisiae functional fingerprints are shown, with labels highlighting the more significant GO clusters. Green and red circles refer to positive (“in taxon”) and negative (“never in taxon”) GO constraints, respectively. The bottom box reports the comparison of the two maps and some of the most relevant differences found between the two taxa are labeled. Red and violet circles refer to GO terms that are only present in A. thaliana and S. cerevisiae, respectively. The radius of the circles depends on the number of collapsed GO nodes or supporting annotations.

