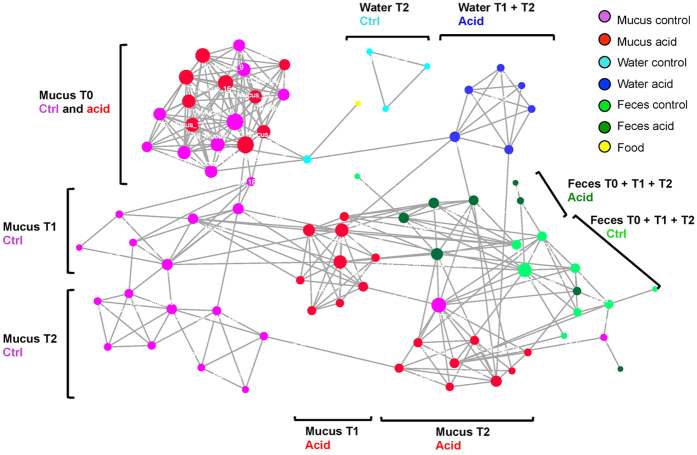
Figure 3. Taxonomic structures diverge between sampling times and ecological niches.
The network of samples based on co-abundance of bacterial genera in each sample. Each dot (node) represents a sample. A link (edge) between two samples highlights a Spearman correlation index > 0.6 between the two samples and a p-value corrected with Bonferroni < 0.05. The size of each node is proportional to the number of edge that it is connected to.

