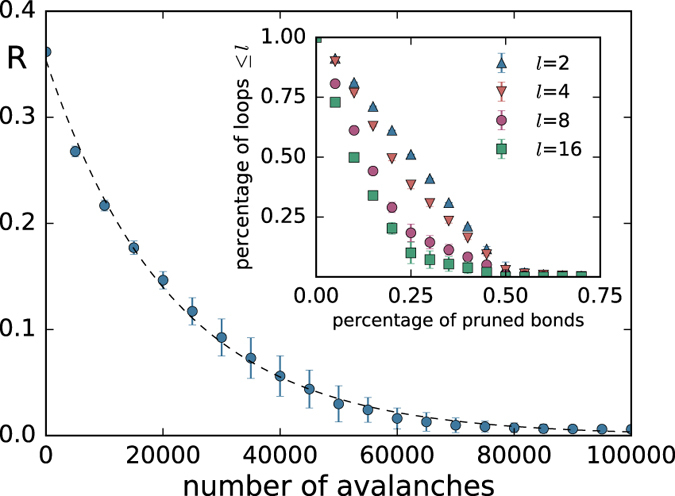
Figure 2. The transition to a branching process can be illustrated by monitoring the flow of potential.

R is the average fraction of potential variation at neurons which have previously been active during the propagation of one avalanche. In a branched network R is zero. The plasticity process modifies the square lattice and the propagation of avalanches becomes a branching process. The dashed line shows an exponential fit. The inset shows the percentage of loops of length ≤l remaining in the network at different stages of pruning. The number of loops goes to zero during plasticity and larger loops disappear more rapidly than smaller loops.
