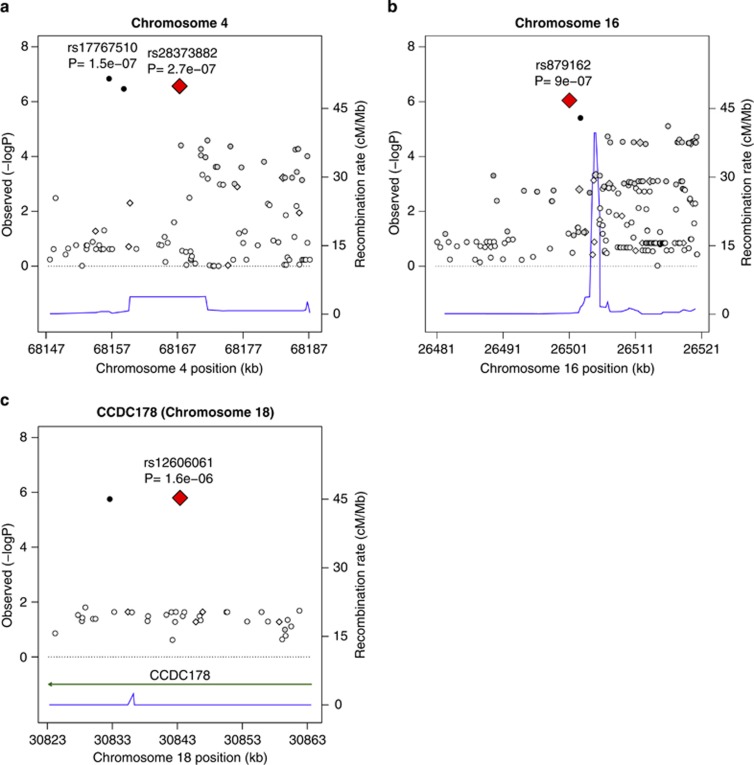
Figure 2.
Regional association plots for the top three loci for inherited effects: rs28372882 (a), rs879162 (b) and rs12606061 (c). Diamonds indicate typed SNPs (with the top hit magnified) and circles indicate imputed SNPs. SNPs in high linkage disequilibrium (r2≥0.80) with the typed hit are shown in black, whereas SNPs in moderate (0.80>r2≥0.50), low (0.50>r2≥0.20) or no linkage disequilibrium (r2<0.20) are shown in dark gray, gray, and white, respectively. The thin black line indicates the recombination rate for the identified region (in cM/Mb) and any nearby genes are shown with a bold solid line. A full color version of this figure is available at the European Journal of Human Genetics journal online.

