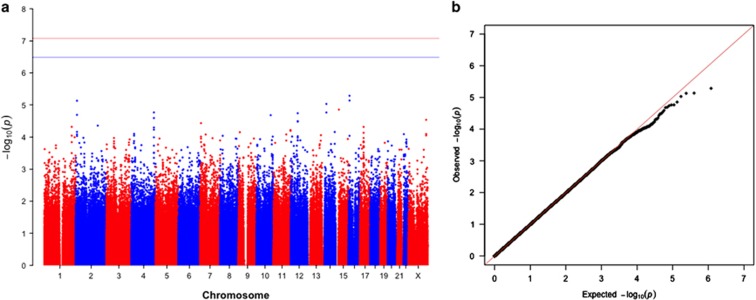
Figure 3.
Manhattan plot (a) and quantile–quantile plot (b) of maternal genetic effects on the risk of young-onset breast cancer in non-Hispanic white women. The solid line in the Manhattan plot indicates the Bonferroni cut-point for 602 140 tests SNPs (P=8.2 × 10⁻⁸) and the dashed line indicates the cut-point for a false-discovery rate correction of 0.20. A full color version of this figure is available at the European Journal of Human Genetics journal online.

