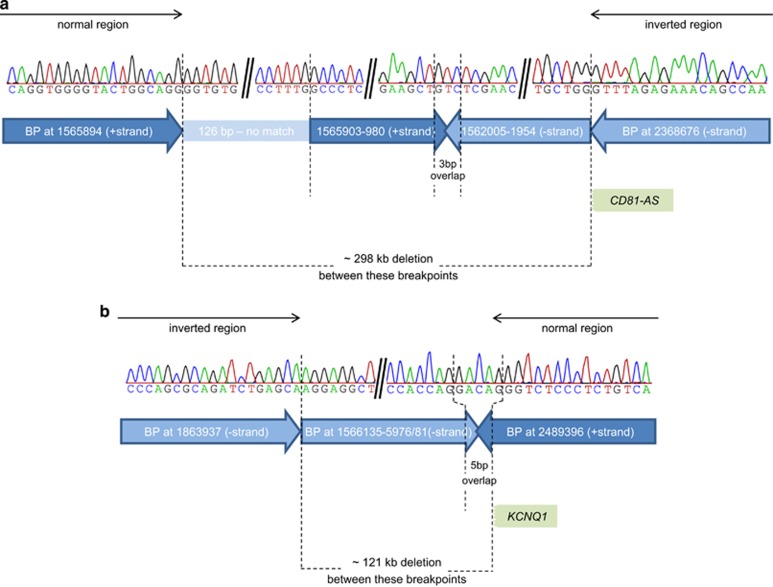
Figure 4.
Detailed overview of the breakpoints with Sanger sequencing results. The figure shows the results of the Sanger sequencing of the two breakpoint regions (a and b) with the corresponding chromosome positions and orientations (based on hg19). The corresponding strand is indicated by the direction and colours of the arrows (dark blue – positive strand; light blue – negative strand). Not drawn to scale.

