Figure 1.
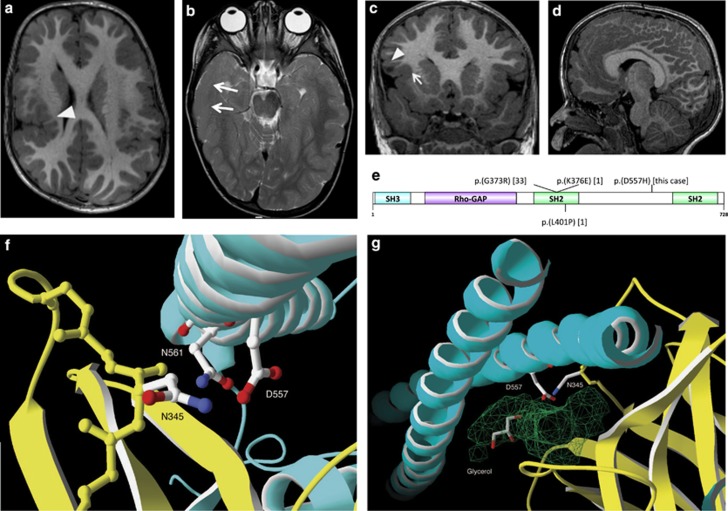
Brain MRI, localization and modeling of PIK3R2-mutated residue. (a-d) Brain MRI of the patient. (a) T1-weighted axial image: bilateral frontoparietal polymicrogyria and incomplete perisylvian opercularization of the right hemisphere (white arrowhead). (b) T2-weighted axial image: thickness and blurring of the cortex-white matter junction in the right temporal cortex (white arrows) with diminished myelination of the underlying white matter and hypoplasia of right cortico-spinal tract. (c) T1-weighted coronal image shows thick cortical infolding with subtle cortical-white matter blurring in the anterior right insula (white arrow) and a cystic lesion in the right frontal operculum (white arrowhead). (d) T1-weighted mid-sagittal image: increased thickness of corpus callosum. Additional brain MRI images are shown in Supplementary Figure S3. (e) Schematic representation of the PIK3R2 protein domains and positions of the variants reported in literature. Thirty-three cases with c.1117G>A (p.(G373R)) de novo and mosaic variants, one case with a de novo c.1126A>G (p.(K376E)) variant and one case with a p.(L401P) de novo variant2, 5, 12, 13 were reported beside the c.1669G>C (p.(D557H)) patient described here. SH3, Src homology 3 domain; Rho-GAP, Rho GTPase-activating protein domain; SH2, Src homology 2 domain. (f, g) Context of the c.1669G>C (p.(D557H)) variant. The PIK3CA (uniprot P42336) and PIK3R2 (uniprot O00459) are shown in yellow and cyan ribbon diagrams according to the PDB entry 4l2y model, respectively. (f) Detail view of the interaction showing PIK3R2 D557 and PIK3CA N345 forming an H-bond. (g) Groove of ~311 Å3 (in green) with a glycerol molecule present in the pdb entry complex showing PIK3R2 D557 residue in direct contact with its surface. A general view of the interaction between PIK3R2 and PIK3CA and positioning of H557 is shown in Supplementary Figure S6.

