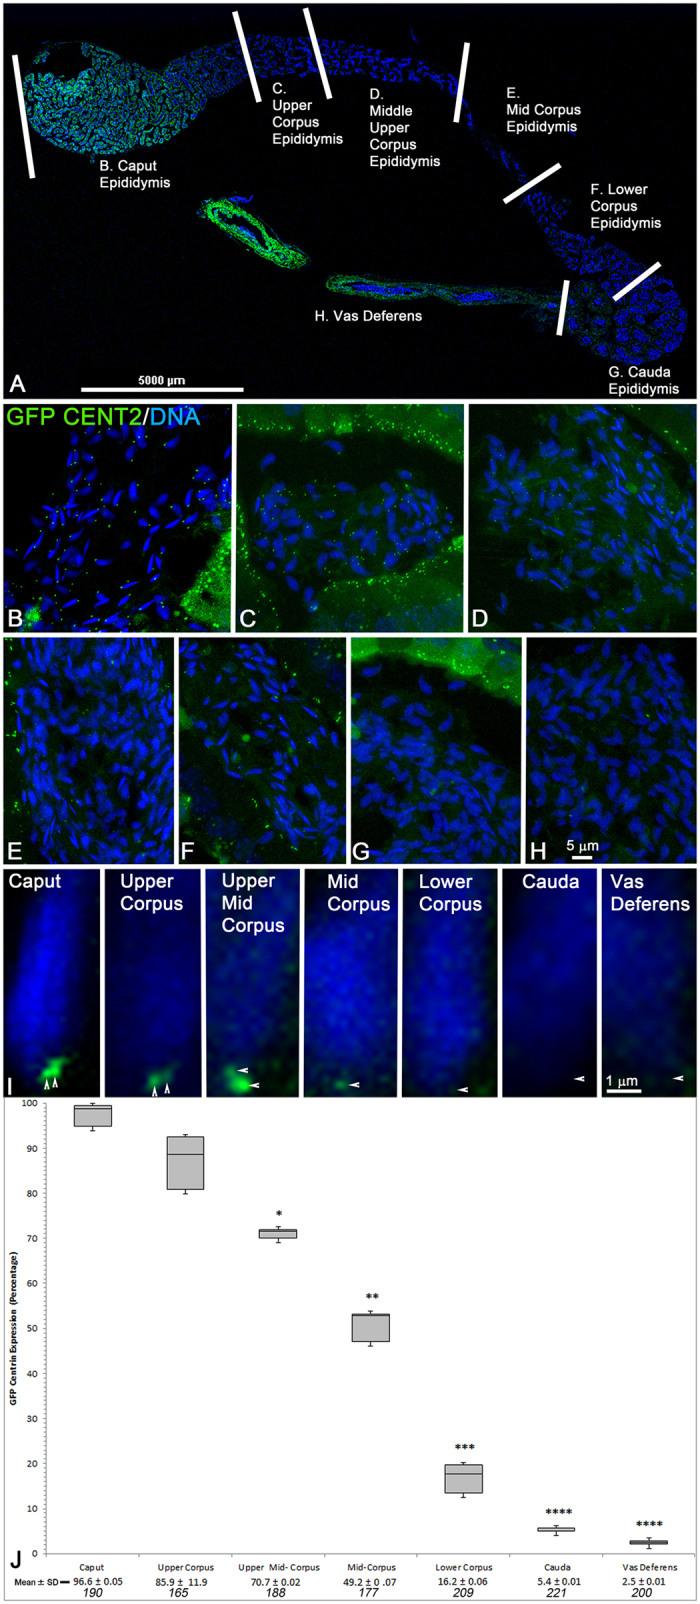
Figure 2. GFP Centrin Is Lost From Sperm Centrioles During Transit Through Epididymis; Centrin Detected in Only 5.4% and 2.5% of Sperm Centrioles in the Cauda Epididymis or Vas Deferens, Respectively.

(A) Confocal stitched photomontage of GFP-CETN2 in complete epididymis with associated vas deferens. High magnification confocal images collected from tubule cross-sections from defined epididymal areas57 (delineated by white bars), including the caput (B), upper corpus (C), upper middle corpus (D), mid-corpus (E), lower corpus (F), cauda (G) and vas deferens (H). (B–H) Cross-sections of single tubules from epididymis and vas deferens in (A). GFP-CETN2 is brightly expressed in centrioles (green) from caput (B), upper corpus (C) and middle upper corpus (D) sperm, as well as luminal cell basal bodies. GFP-CETN2 signal diminishes significantly in the mid-to-lower corpus, with bright luminal GFP-CETN2 basal body expression serving as internal control (E,F: green). Spermatozoa from the cauda (G) and vas deferens (H) rarely express GFP centrin at the implantation fossa centriolar region (green) although lumen cells retain distinct basal body GFP-CETN2 expression. (I) Series of GFP-CETN2 expression in sperm from epididymal sections identified in (A) demonstrating the gradual dissolution of the proximal and distal centrioles at the implantation fossa during epididymal transport toward the cauda and vas deferens (green, arrowheads). (J) Quantification of GFP-CETN2 sperm centriole dissolution during epididymal transport as shown in (A). The box plot shows median (horizontal lines), 25th and 75th percentiles (boxes), and 5th and 95th percentiles (whiskers) of percentage of GFP-CETN2 centriole expression at the implantation fossa at each stage of transport through the epididymis. The mean ± standard deviation (SD) and total number of sperm counted (specified in italics; minimum of 3 tubules per section) is given at graph bottom. *P < 10−3; **P < 10−4; ***P < 10−5; ****P < 10−6 (Student’s t-test). All confocal imaging employed identical exposure settings (z-depth sections; 488 laser line intensity; image box size). All images: direct GFP centrin expression (green) and DNA with Hoechst 33342 (blue). Bars: μm.
