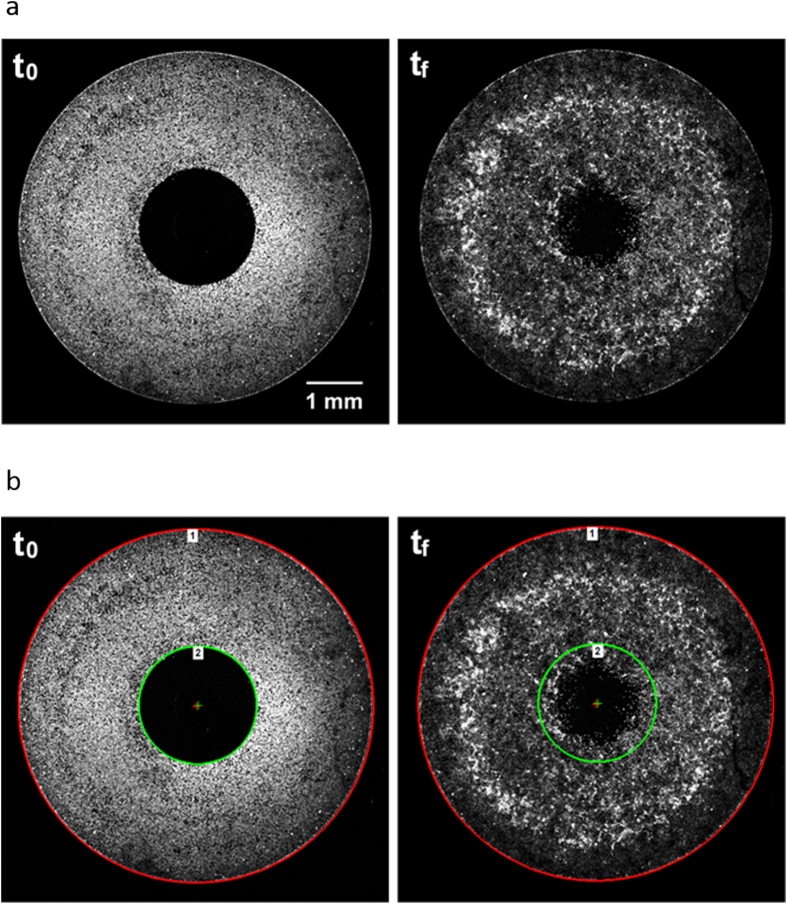
Figure 1. Image analysis method for using a lineage tracing dye to quantify cell migration.
(a) CP-A cells in Oris™ migration wells were labeled with CellTrace Violet and the pre-migration, t0 image was captured (left panel). Cells were allowed to migrate for 14 hours, then the final image, tf, was captured (right panel). (b) Two regions of interest (ROIs) were created on the t0 image (left). ROI-1 (red) includes all cells, ROI-2 (green) delineate the edge of the cell-free exclusion zone. Both ROIs are pasted, maintaining their relative postions, onto the post-migration, tf, image (right). Migration is assessed as the percent of flourescent signal in ROI-2 relative to total fluorescence (ROI-1).

