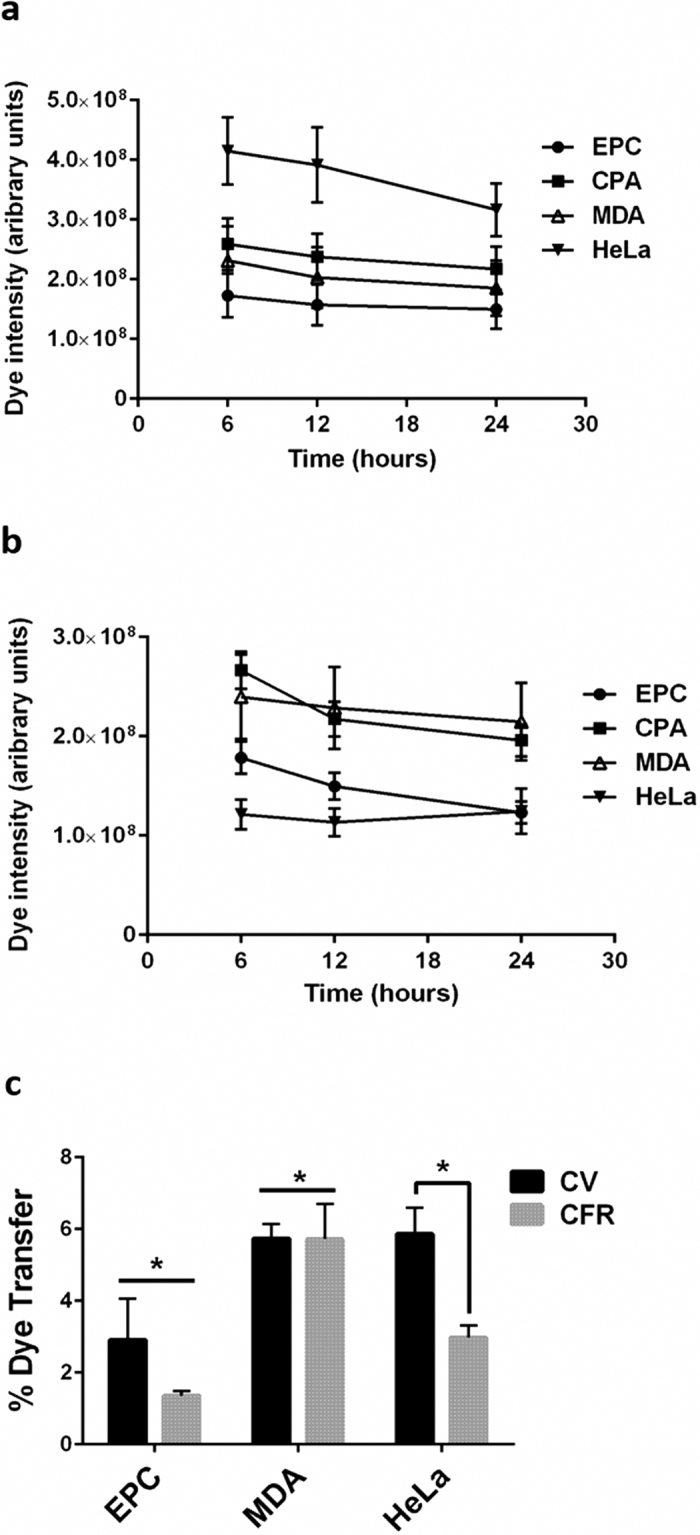
Figure 3. CellTrace dye retention.

Adherent EPC2 (EPC), CP-A (CPA), MDA-MB-231 (MDA), and Hela cells were labeled with CellTrace Violet (a) or CellTrace Far Red (b). Cells from the entire well were imaged at 6, 12, and 24 hours post staining. There was no significant change in CellTrace Violet signal intensity in any cell type. There was a significant loss in CellTrace Far Red in EPC2 and CP-A cells at 24 hours (p = 0.03) but not at 12 hours. Data were pooled from two independent experiments each conducted in duplicate. (c) Cells were labeled with CellTrace Violet or CellTrace Far Red in suspension, then cells were seeded as single-stained populations or mixed samples and imaged 24 hours post-seeding. Image cytometry was conducted on images of 300–500 cells. Dye transfer is calculated as the intensity of the transferred dye signal relative to the intensity of the same signal in the single-labeled population. Data were pooled from two independent experiments each conducted in triplicate. Error bars indicate SEM, results were analyzed by one-way ANOVA. * indicates p < 0.05.
