Figure 2.

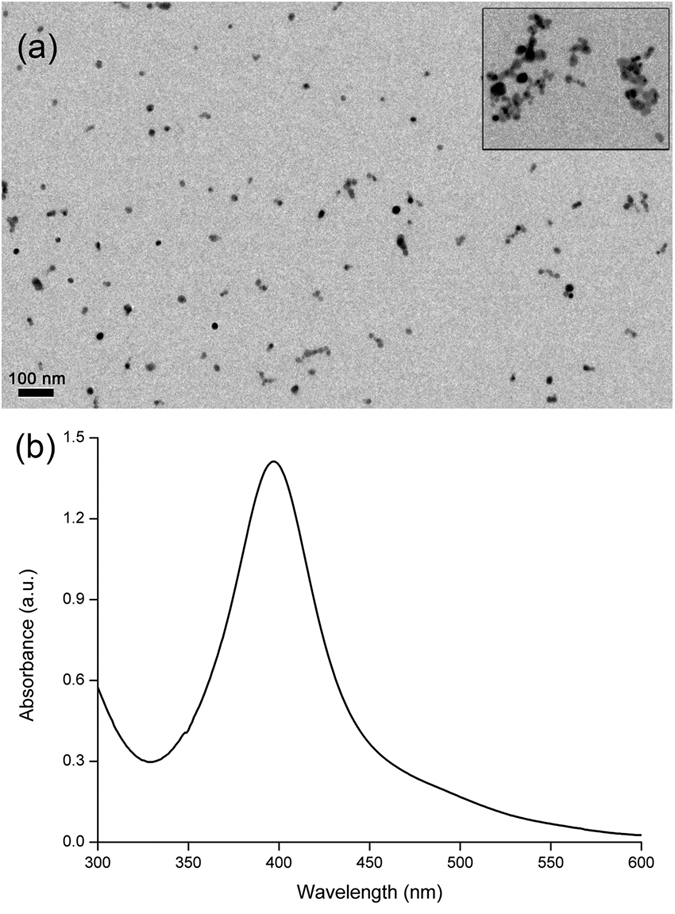
(a) TEM image of AgNPs. Inset is the image after miRNA induced HP0 release and subsequent HCR. (b) UV–vis spectrum of bare AgNPs.

(a) TEM image of AgNPs. Inset is the image after miRNA induced HP0 release and subsequent HCR. (b) UV–vis spectrum of bare AgNPs.