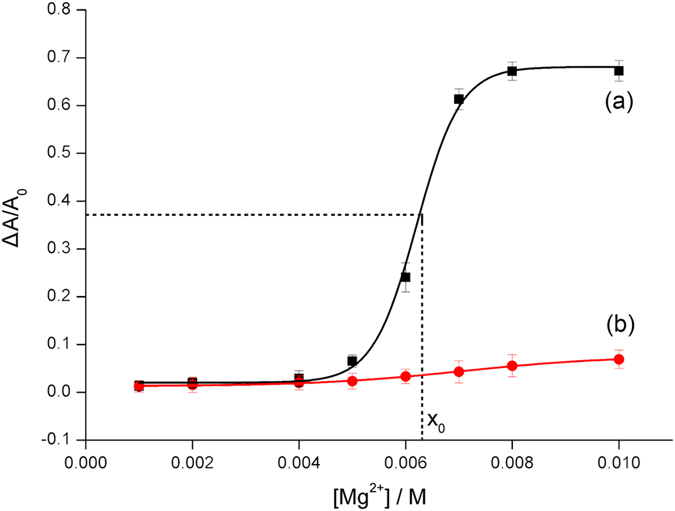
Figure 3.

ΔA/A0 of (a) bare AgNPs, (b) HP1 and HP2 protected AgNPs versus the concentration of Mg2+. The slim dash lines represent the position of the critical point for salt-tolerance of bare AgNPs. Error bars represent standard deviations of three measurements.
