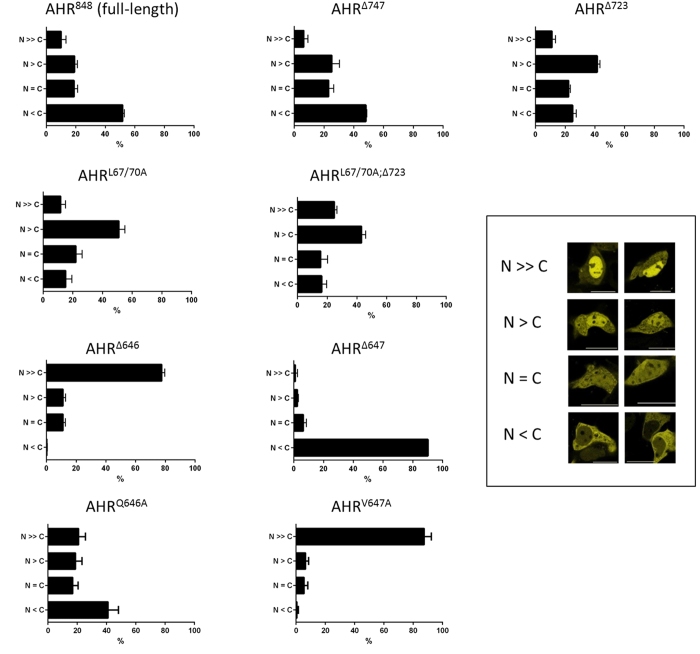
Figure 3. Compartmentalisation of EYFP-AHR mutants in transfected cells.
A total of at least 300 positive cells that were found in randomly selected optical fields were analysed and classified after 24 h according to the defined staining patterns. Data represent the mean +/− S.D. out of three independent transfections. Insert: Staining patterns have been defined according to shown examples. N >> C exclusively nuclear; N > C predominantly nuclear; N = C equal distribution; N < C predominantly cytoplasmic.

