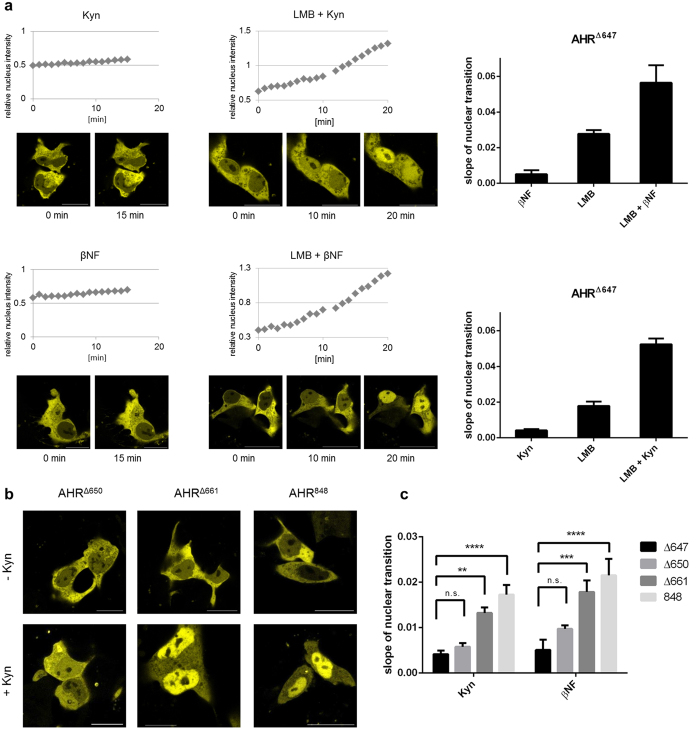
Figure 4. Ligand-induced nuclear association of the AHR depends on the Q-rich domain.
(a) Translocation of EYFP-AHR∆647 into the nucleus in HepG2 cells after treatment with 100 μM Kyn or 10 μM βNF for 15 min (left). Translocation of AHR∆647 after exposure to 40 nM LMB for 10 min, followed by direct addition of 100 μM Kyn or 10 μM βNF for another 10 min (middle). Representative images of treated cells are shown for the indicated time points (scalebar = 20 μm). Nuclear transition was recorded and analysed as described in Fig. 1a. Slopes of the linear transition graphs have been separately determined for single and combined treatments (right). Each bar represents the mean +/− S.E.M. of 6 analysed cells. (b) Snapshots of cells imaged from transfected populations that were treated for 1 h with Kyn or left untreated. In response to ligand, AHR∆661 and full-length AHR848 showed a nearly exclusive nuclear staining pattern, while AHR∆650 remained predominantly cytoplasmic as in non-treated cells. Similar effects were observed after application of βNF. (c) Residues 648–661 are required for ligand-induced nuclear accumulation of the AHR. Cells expressing AHR∆647, AHR∆650, AHR∆661 or AHR848 (full-length) were treated with 100 μM Kyn or 10 μM βNF. Both, AHR∆661 and AHR848 showed significantly higher nuclear translocation rates than AHR∆647 (two-way ANOVA, **p < 0.01, ***p < 0.001, ****p < 0.0001). No such significant differences were observed between AHR∆647 and AHR∆650. Values depicted represent the mean +/− S.E.M of at least 5 cells.

