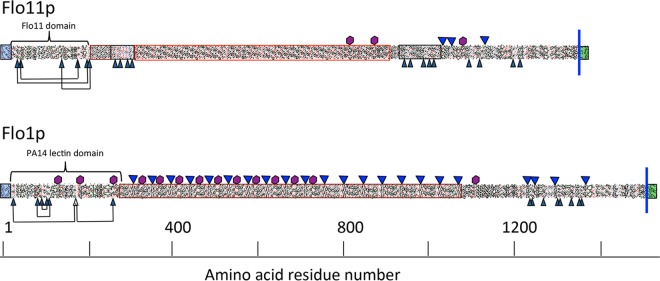
FIG 1 .
Primary-structure analyses of Flo1p and Flo11p. Hydrophobic-cluster analyses highlight domain structure and patterns of repeats (15). Secretion signal sequences are boxed in blue, C-terminal GPI addition signals are boxed in green, and the blue line denotes the position of GPI signal cleavage and anchorage to cell wall glucan (13). Central repeat regions are in unshaded boxes. Cys residues are black arrowheads, with disulfides marked where they have been mapped in the N-terminal domains (12). Potential N-glycosylation sites are marked with purple hexagons, and sequences with a β-aggregation potential of >30% in TANGO are marked with blue triangles (21).

