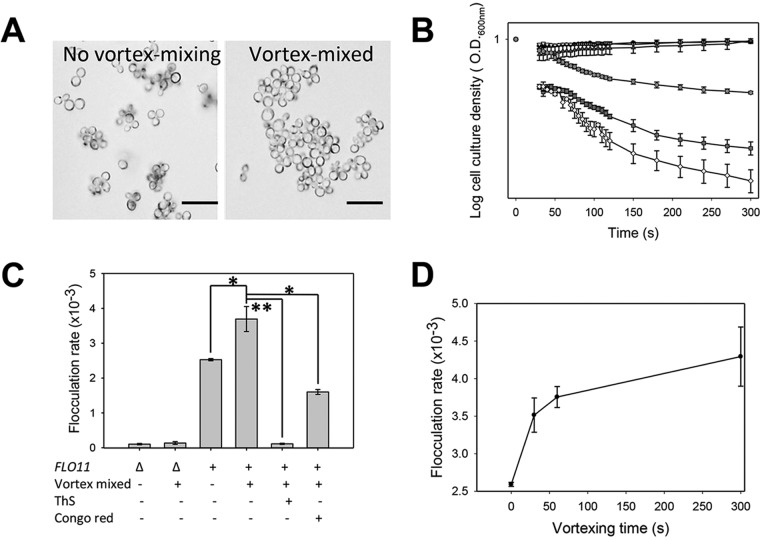
FIG 2 .
Effects of vortex mixing on the extent and rate of flocculation of S. cerevisiae var. diastaticus cells expressing Flo11p. (A) Cells were left untouched or vortex mixed and then visualized in the absence of Ca2+. Scale bars = 20 µm. (B) Flocculation assays after the addition of 330 µM Ca2+. Cells assayed: Δflo11 mutant not mixed (black circles, top) or vortex mixed for 5 min (inverted triangles, top); FLO11 cells not mixed (dark gray boxes) or vortex mixed in the absence of inhibitors (light-shaded diamonds) or in the presence of 200 µM ThS (dark triangles, top) or 500 µM CR (gray circles). Each error bar shows the standard error of the mean of three or more values. (C) Inhibition by ThS (200 µM) and CR (500 µM) (n = 3). Flocculation rates were calculated between 40 and 80 s. *, P < 0.05; **, P < 0.001 (Student’s t test). (D) Effect of the duration of vortex mixing on the flocculation rate. Each error bar shows the standard error of the mean of three values.

