
FIG 5 .
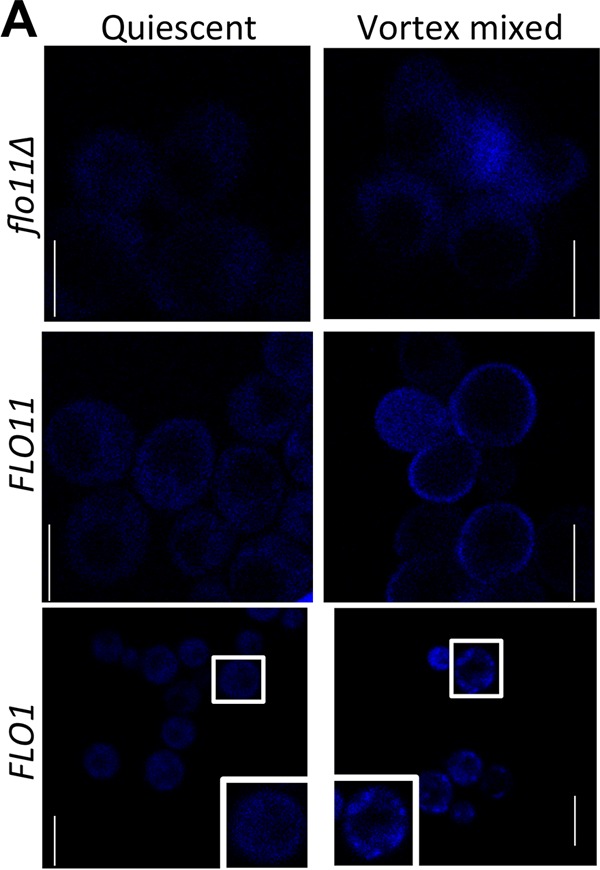
ThT fluorescence on the surface of Flo11p- and Flo1p-expressing S. cerevisiae. Shown are fluorescence confocal micrographs of cells under quiescent and vortex-mixed conditions taken right after vortex mixing as described in Materials and Methods and then stained with 500 nM ThT. Scale bars represent 5 µm. The boxed cells are further enlarged in the insets.