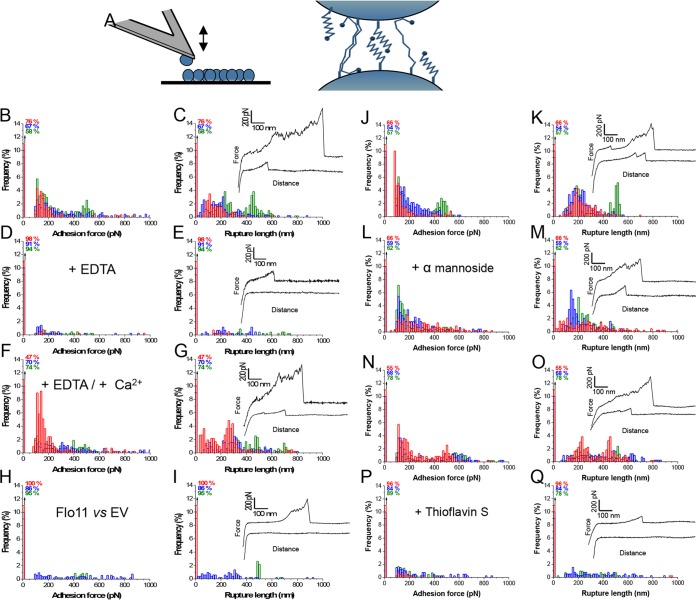
FIG 7 .
Forces in Flo11p-mediated cell-cell adhesion. (A) Principle of single-cell force spectroscopy. (Left) Single yeast cells were attached to a polydopamine-coated tipless cantilever, and curves of force between cell probes and yeast aggregates were acquired. (Right) Cartoon of homotypic interactions of the flocculins. Shown are adhesion force histograms (B, D, F, H, J, L, N, P) and rupture length histograms (C, E, G, I, K, M, O, Q) with representative force curves obtained by recording multiple force-distance curves for Flo11p-expressing cells in acetate buffer containing 200 µM CaCl2 (B, C) or after the addition of 10 mM EDTA (D, E) and further addition of 400 µM CaCl2 (F, G). (H, I) Force data obtained with Flo11p-expressing cells and yeast cells expressing no flocculin (EV). (L, M) Effects of methyl alpha-d-mannopyranoside at 40 mg/ml added to the buffer in the experiments shown in panels J and K. For those shown in panels P and Q, 200 µM ThS was added to the cells shown in panels N and O. Red, blue, and green represent results from three different cell pairs from independent cultures (n = >400 curves for each cell). All curves were obtained at 20°C by a constant approach at a retraction speed of 1 µm ⋅ s−1 with a 1-s contact time.

