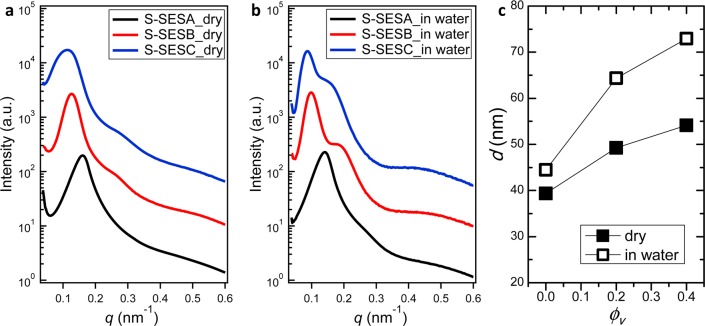
Figure 1.
SAXS intensity as a function of the magnitude of scattering vector, q, for dry S-SES membranes (a) and hydrated S-SES membranes (b). Scattering profiles are vertically shifted for clarity. Black, red, and blue profiles in (a) and (b) represent S-SESA, S-SESB, and S-SESC, respectively. (c) Domain spacing, d, of dry and hydrated S-SES membranes as a function of ϕv.

