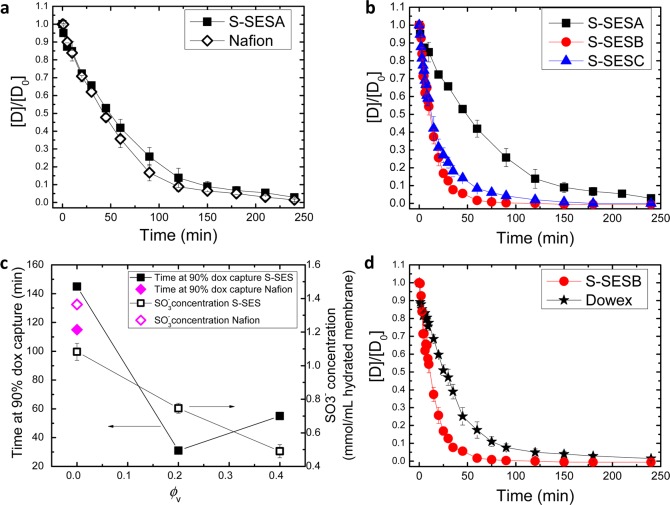
Figure 3.
(a, b) Concentration of doxorubicin at a given time, [D], normalized by the initial concentration of doxorubicin, [D0] = 0.05 mg mL–1, as a function of capture time. Open diamonds in (a) represent Nafion. Solid squares in (a) and (b) represent S-SESA. Red circles and blue triangles in (b) represent S-SESB and S-SESC, respectively. (c) Time at 90% doxorubicin capture (solid data points) and SO3– concentration (open data points) as a function of ϕv. Squares represent S-SES membranes. Diamonds represent Nafion. (d) [D]/[D0] as a function of capture time for S-SESB (circles) and Dowex ion-exchange resin (stars).

