
Figure 5.
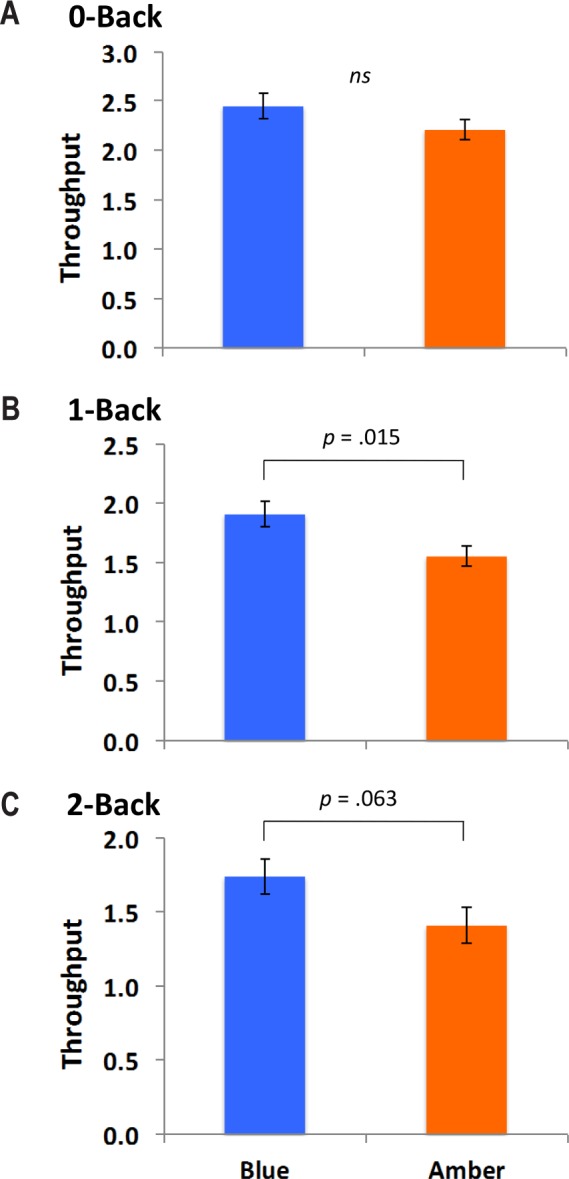
The figure shows group differences in working memory cognitive throughput (Accuracy × [1 / RT] * 1,000), which is a measure of the speed × accuracy trade-off. (A) There was no difference between the blue and amber groups with regard to throughput performance on the zero-back task. (B) On the one-back task, the blue light group showed significantly enhanced throughput performance compared to the amber control group. (C) On the two-back task, there was a marginally significant trend toward greater throughput for the blue compared to the amber control group.