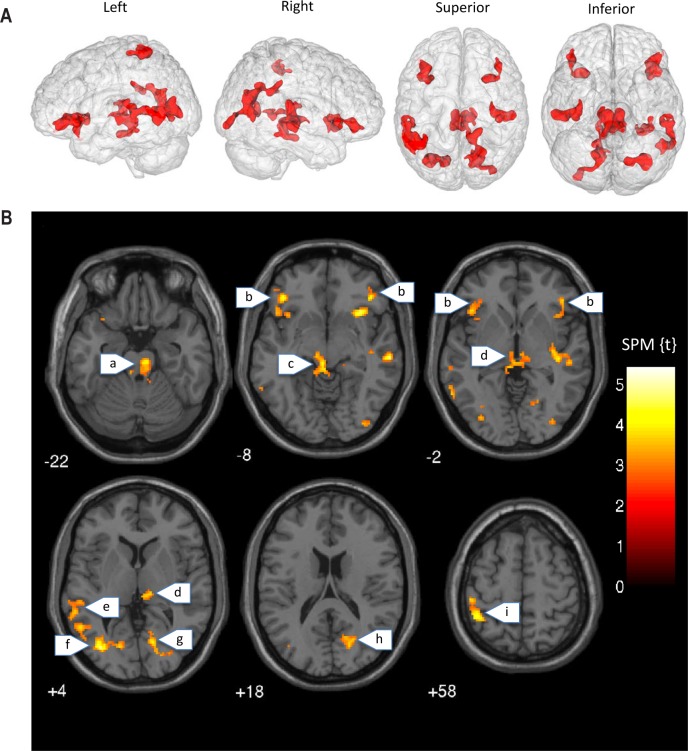
Figure 6.
Whole brain exploratory analysis (height P < 0.005, cluster corrected P < 0.05, FWE). (A) The “glass brain” figures show the location of significant clusters of brain activation where Blue > Amber for the N-Back Task (two-back > zero-back). (B) The axial slices show the aforementioned clusters in greater anatomical detail. Blue light was associated with greater activation than amber control within: (a) pons, (b) inferior frontal gyrus, (c) superior brainstem, (d) thalamus, (e) middle temporal gyrus, (f) middle occipital gyrus, (g) lingual gyrus, (h) calcarine cortex, (i) inferior parietal lobule.

