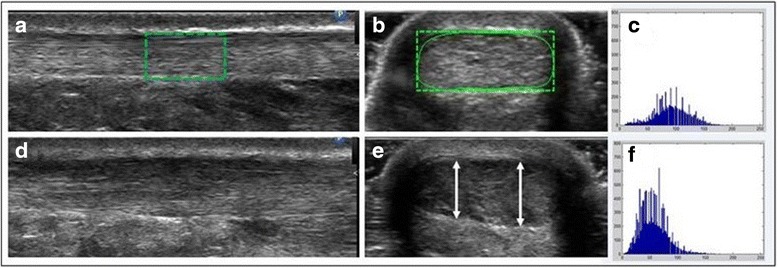
Fig. 1.

a ROI of a healthy AT in longitudinal view; b ROI of a healthy AT in transverse view; c grayscale histogram derived from the ROI of image (b); d Pathologic AT in longitudinal view; e Pathologic AT in transverse view with arrows indicating the AT’s thickness at different locations in the sagittal plane; f grayscale histogram derived from the ROI of image (e)
