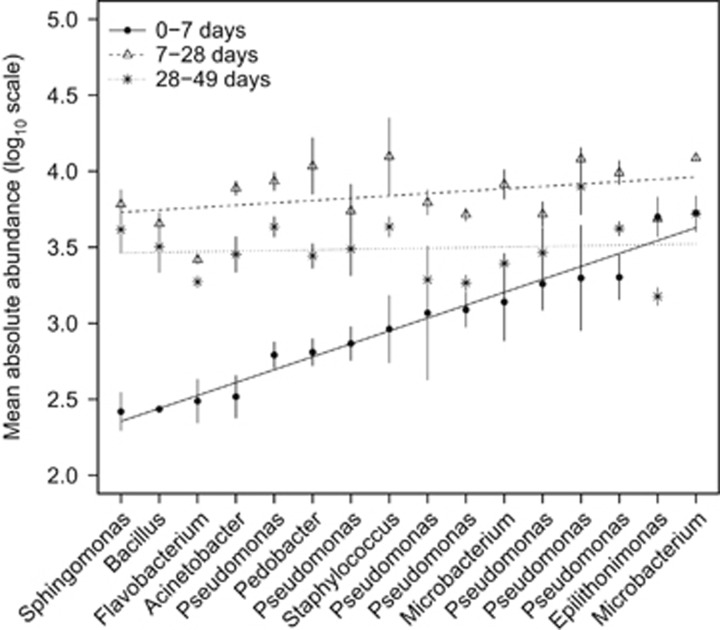
Figure 1.
The mean abundance (cell counts ml−1) of each of the isolates counted using the total microcosm cell counts multiplied by the relative terminal restriction fragment length polymorphism (tRFLP) band intensities of each isolate within a given microcosm. The isolates were ranked based on their abundance after 7 days coculture. These data show that those isolates that are rarest at 7 days increase to the same level as the dominant isolates by the conclusion of the experiment. Regression lines and means±1 s.e. are presented.

