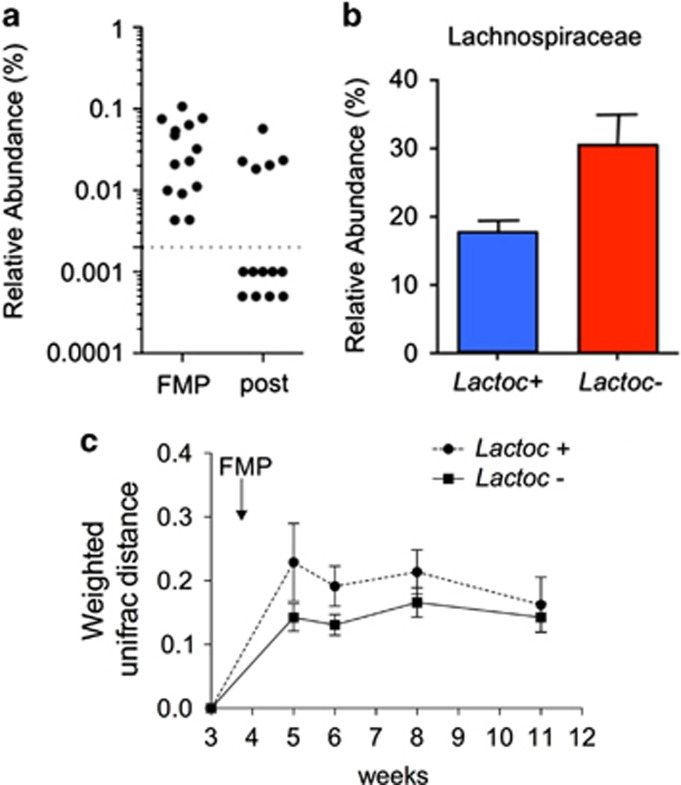
Figure 4.
Evidence of permissive and resistant phenotypes in human (a) Distribution of Lactococcus carriers (Lactoc+) and non-carriers (Lactoc–) during and after the FMP administration. (b) Relative abundance of Lachnospiraceae in Lactococcus carriers and non-carriers. (c) Kinetics of weighted UniFrac distances of Lactoc+ and Lactoc– subjects expressed as mean±s.e.m. A linear mixed model showed a difference (P=0.086) between groups across the intervention. x axis label (weeks) were numbered as per the Mc Nulty et al. study.

