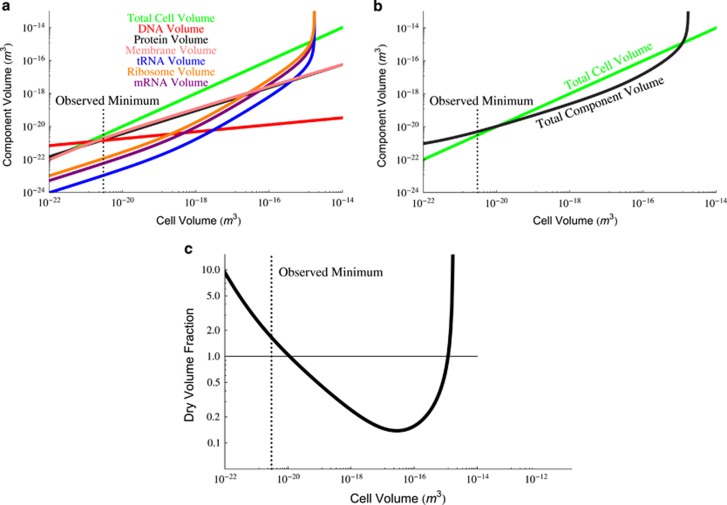
Figure 3.
(a) The volume-dependent scaling of each of the major cellular components for bacteria. (b) The total cell volume compared with the volume of all cellular components as a function of cell size. (c) The fraction of total cell volume that is occupied by the essential components. It should be noted that in each of these plots we have extrapolated curves to regions that are not physically possible (such as the dry fraction exceeding 1) in order to illustrate crossings that represent limiting sizes, and to show the increasing challenges faced by bacteria beyond these critical values.

