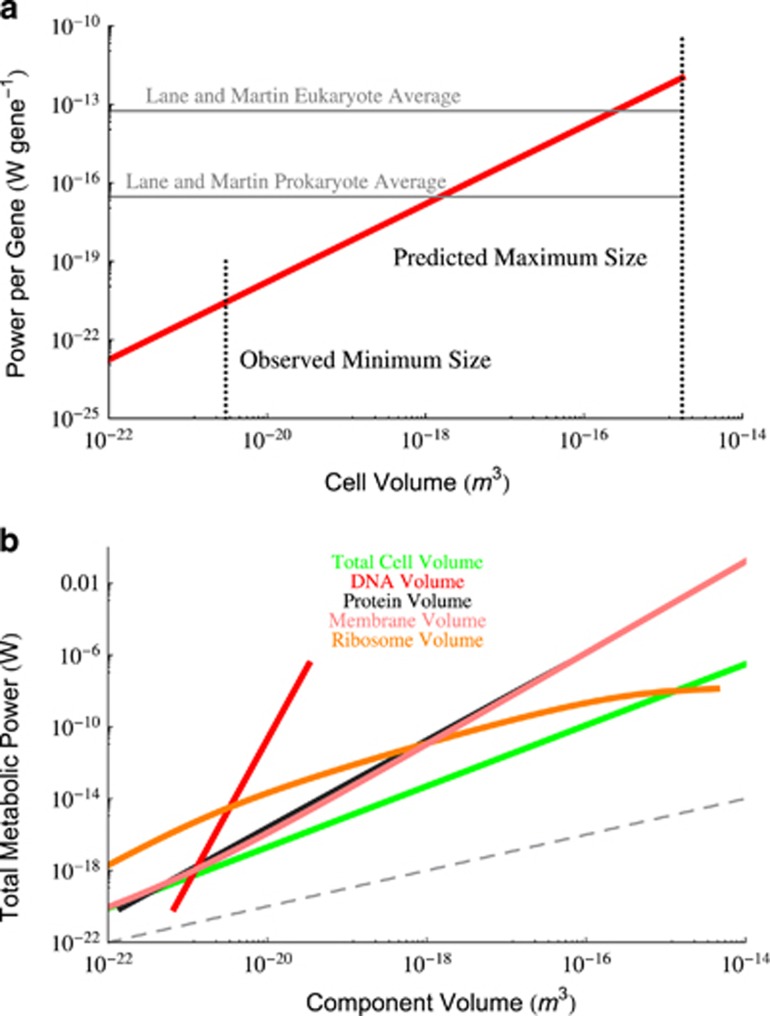
Figure 4.
(a) The estimated scaling of metabolic rate per gene as a function of overall cell volume calculated from the scaling of genome size here and the data from DeLong et al. (2010). Previous average values from Lane and Martin (2010) for prokaryotes and eukaryotes are both shown. It can be seen that the previous prokaryote average value agrees with the scaling for the middle range of bacteria, and that bacterial values are close to the eukaryotic average value for the largest bacteria. Surprisingly, bacteria are increasing the metabolic rate per gene with a scaling exponent of 1.49. (b) Scaling of the total cellular metabolism as a function of the total volume of each cellular component. It can be seen that all of these relationships scale with an exponent greater than 1 (linear scaling is indicated by the gray dashed line), implying that metabolism is not a simple proportionality of any single cellular component. This suggests that the way in which cellular components are combining to produce superlinear scaling in cells is a complicated and emergent phenomena. Most notably, metabolic rate scales with total genome volume with an astonishing power of ≈ 8.

